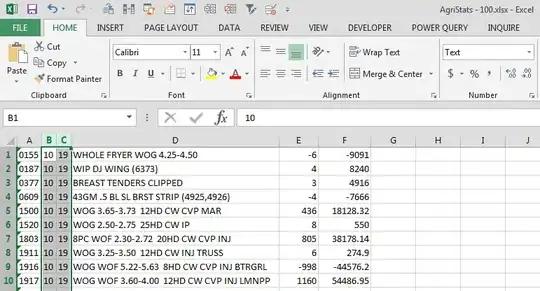
Given two monthly time series data sample from this link.
I will need to create one plot containing 3 subplots: plot1 for the original values, plot2 for month over month changes, and plot3 for year over year changes.
I'm able to draw the plot with code below, but the code is too redundant. So my question is how could achieve that in a concise way? Thanks.
library(xlsx)
library(ggplot2)
library(reshape)
library(dplyr)
library(tidyverse)
library(lubridate)
library(cowplot)
library(patchwork)

df <- read.xlsx('./sample_data.xlsx', 'Sheet1')
colnames(df)
# df

cols <- c('food_index', 'energy_index')
df <- df %>% mutate(date=as.Date(date)) %>%
  mutate(across(-contains('date'), as.numeric)) %>%
  mutate(date= floor_date(date, 'month')) %>%
  group_by(date) %>%
  summarise_at(vars(cols), funs(mean(., na.rm=TRUE))) %>%
  mutate(across(cols, list(yoy = ~(. - lag(., 12))/lag(., 12)))*100) %>%
  mutate(across(cols, list(mom = ~(. - lag(., 1))/lag(., 1)))*100) %>%
  filter(date >= '2018-01-01' & date <= '2021-12-31') %>%
  as.data.frame()

df1 <- df %>%
  select(!grep('mom|yoy', names(df)))

df1_long <- melt(df1, id.vars = 'date')
plot1 <- ggplot(df1_long[!is.na(df1_long$value), ],
       aes(x = date,
           y = value,
           col = variable)) +
  geom_line(size=0.6, alpha=0.5) +
  geom_point(size=1, alpha=0.8) +
  labs(
    x='',
    y='Unit: $'
  )

# MoM changes
df2 <- df %>%
  select(grep('date|mom', names(df)))

df2_long <- melt(df2, id.vars = 'date')
plot2 <- ggplot(df2_long[!is.na(df2_long$value), ],
       aes(x = date,
           y = value,
           col = variable)) +
  geom_line(size=0.6, alpha=0.5) +
  geom_point(size=1, alpha=0.8) +
  labs(
    x='',
    y='Unit: %'
  )

# YoY changes
df3 <- df %>%
  select(grep('date|yoy', names(df)))

df3_long <- melt(df3, id.vars = 'date')
plot3 <- ggplot(df3_long[!is.na(df3_long$value), ],
       aes(x = date,
           y = value,
           col = variable)) +
  geom_line(size=0.6, alpha=0.5) +
  geom_point(size=1, alpha=0.8) +
  labs(
    x='',
    y='Unit: %'
  )
plot <- plot1 + plot2 + plot3 + plot_layout(ncol=1)
# plot <- plot_grid(plot1, plot2, plot3, labels = c('Value', 'MoM', 'YoY'), label_size = 12)
plot
Out:
The expected result will be similar to the plot below (the upper plot will display the original data, the middle plot will display the mom changes data, and the lower plot will display the yoy changes data):
References:


