To get your example to work I had to add in st_make_valid() before summarise(), because I got an error saying some features had invalid geometries.
world_one <- world %>%
  dplyr::select(sov_a3) %>%
  mutate(sov_a3 = "world") %>%
  group_by(sov_a3) %>%
  summarise()
# Error in s2_geography_from_wkb(x, oriented = oriented, check = check) :
# Evaluation error: Found 3 features with invalid spherical geometry.
# [7] Loop 7 is not valid: Edge 171 crosses edge 174
# [55] Loop 1 edge 0 crosses loop 2 edge 2
# [139] Loop 3 edge 0 crosses loop 4 edge 4.
world_one <- world %>%
dplyr::select(sov_a3) %>%
mutate(sov_a3 = "world") %>%
group_by(sov_a3) %>%
st_make_valid() %>%
summarise()
world_one %>% plot()
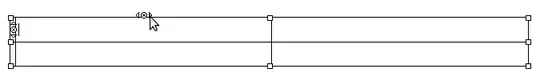
Hopefully the resulting plot is the same as what you are seeing, and the same unexpected horizontal lines (circled in red).

If so, I'm pretty sure the lines are due to a few countries who have land masses on "either side of the world" - i.e. they cross the 180th meridian (e.g Russia).
Now I'm not 100% sure why or at what stage this happens exactly, but because we have used summarise() to combine all features in world, I suspect R has connected polygons from the same country, even though they are on opposite ends of the map, and therefore creates these unexpectedly shaped "countries", which are the lines you can see.
Without using st_make_valid() (and therefore not using summarise()), the countries plot as expected, but we have the country boundaries included still, so although this doesn't produce the desired plot, maybe it can give you some ideas as to why it isn't working.
world %>%
  dplyr::select(sov_a3) %>%
  mutate(sov_a3 = "world") %>%
  group_by(sov_a3) %>%
  # st_make_valid() %>%
  # summarise() %>%
  plot
If we just use Russia as the problem example, the across-the-world-lines issue arises when we use st_make_valid().
world %>%
  filter(
    str_detect(name_sort, 'Russia')
  ) %>%
  {. ->> russia}

russia %>%
  ggplot()+
  geom_sf()

russia %>%
  st_make_valid %>%
  ggplot()+
  geom_sf()

Unfortunately, I don't know how to get around this issue at the moment, but this should get you thinking anyway. It seems like the issue is related to invalid geometries, and the inability to union them.
Links which might be useful:


