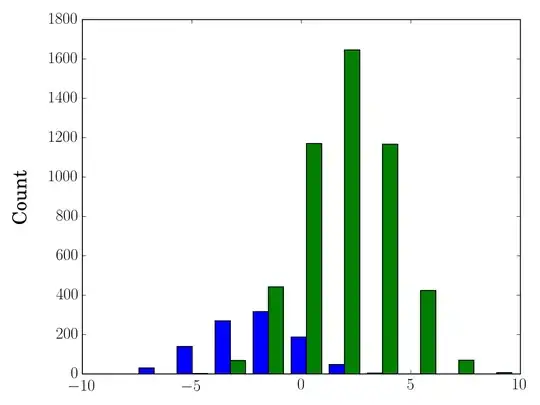
I want to adjust the font size of the x-Axis labels and y-labels.
    plt.style.use("dark_background")
    self.figure = plt.figure(figsize=(12, 2), dpi=120)
    self.canvas = FigureCanvas(self.figure)
    self.figure.clear()

    fig = self.figure.add_subplot(111)
    df = pd.DataFrame({'Year': years, 'Buyer Count': buyerCount})

    for i in df.index:
        word = df.loc[i, "Buyer Count"]
        y = df.loc[i, "Buyer Count"]
        plt.annotate(f'{word:,.0f}', (i, y), ha="center", va="bottom", fontsize=8)

    sns.barplot(x='Year', y='Buyer Count', data=df).set(title="Buyers".format(year))
    self.customers_chart.addWidget(self.canvas)
    self.canvas.show()
I have tried using
p = sns.barplot(x='Year', y='Buyer Count', data=df).set(title="Buyers".format(year))
p.set_xlabel("X-Axis", fontsize = 12)
p.set_ylabel("Y-Axis", fontsize = 12)
But an error arises:
AttributeError: 'list' object has no attribute 'set_xlabel'

