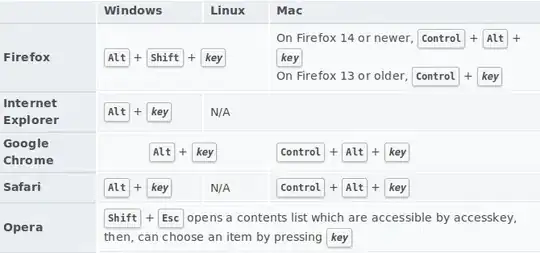
I have a dataframe 'df' (310, 7) and need to plot a pairplot for it. But I'm getting an error <ValueError: cannot reindex from a duplicate axis> when I do it in a regular way.
sns.pairplot(df,hue='Class')
ValueError: cannot reindex from a duplicate axis
The data is of this form: [data]
    P_incidence     P_tilt  L_angle     S_slope     P_radius    S_Degree    Class
0   38.505273   16.964297   35.112814   21.540976   127.632875  7.986683    Normal
1   54.920858   18.968430   51.601455   35.952428   125.846646  2.001642    Normal
2   44.362490   8.945435    46.902096   35.417055   129.220682  4.994195    Normal
3   48.318931   17.452121   48.000000   30.866809   128.980308  -0.910941   Normal
4   45.701789   10.659859   42.577846   35.041929   130.178314  -3.388910   Normal
I tried removing the duplicates using:
df.loc[df['L_angle'].duplicated(), 'L_angle'] = ''
But, this method converts the column to an object and I'm not able to negate it.
The expected output plot is as follows:
[expected]