It is quite easy to create a choropleth using the tidycensus` R package as discussed in Kyle Walker's "Spatial Analysis with US Census Data".
How might one create a bivariate choropleth using Kyle's tidycensus, which acquires Census data through the Census.gov API?
Choropleth with tidycensus => Easy
miami_income <- get_acs(geography = "tract", year = 2020,
                        variables  = c(
                         Median_Income = "B19013_001"
                        ),
                        state = "FL", county = "Miami-Dade County",
                        geometry = TRUE)
plot(miami_income["estimate"])
Bivariate choropleth?
There is a recently developed biscale package by Christopher Prener, Ph.D. that might be useful.
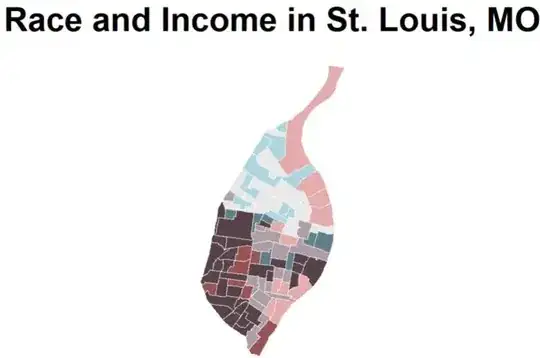
Example from https://cran.r-project.org/web/packages/biscale/vignettes/biscale.html.
## stl_race_income example data in biscale package
stlouis_race_income_bivar <-
  biscale::bi_class(stl_race_income, x = pctWhite, y = medInc, style = "quantile", dim = 3)
# create map
ggplot() +
  geom_sf(data = stlouis_race_income_bivar,
          mapping = aes(fill = bi_class), color = "white",
          size = 0.1, show.legend = FALSE) +
  bi_scale_fill(pal = "GrPink", dim = 3) +
  labs(
    title = "Race and Income in St. Louis, MO",
    subtitle = "Gray Pink (GrPink) Palette"
  ) +
  bi_theme()


