3

I have a table with this format :

User lat lon
u1 x1 y1
u1 x2 y2
u1 x3 y3
u2 x4 y4
u2 x5 y5
u2 x6 y6
u3 x7 y7
u3 x8 y8

What I'd like to do is have a table where for each user I have the distance between the farthest 2 points they've been to.

User max_dist_km
u1 15.2
u2 23.7
u3 8.3

The naive way is to loop over users, create the distance matrix for each user and extract the max distance. This wouldn't be scalable with a huge set of users.

Is there a more efficient and elegant way to proceed ?

mlx
  • 504
  • 1
  • 4
  • 15
  • 1
    You could use Rotating Calipers. Maybe there is an python implementation for it. https://en.wikipedia.org/wiki/Rotating_calipers – Andrew Jul 08 '22 at 14:46
  • 1
    My answer [here](https://stackoverflow.com/a/71412448/7109869) with 3 options to measure the distance between two points (represented by geographic coordinates) might be of help. – Gonçalo Peres Jul 12 '22 at 08:45
  • To your original problem of scaling for efficiency, if you convert 2d coordinates to 1d, would max minus min give you the answer? – S2L Jul 12 '22 at 10:41
  • @S2L, how would you convert 2d coordinates to one ? – mlx Jul 13 '22 at 09:48

5 Answers5

2

Summary

Implemented a fast algorithm which works in linear time

  • US Cities Dataset (30, 409 records): 0.103 seconds
  • Animal tracking dataset (89,867 records): 0.325 seconds
  • Timings on 10+ year old windows desktop (i7 920 CPU @ 2.67GHz)

Approach

Has linear complexity i.e. O(N)

  • N is the total number of lats/lons (i.e. counting across all user)

Perform the following steps:

  1. Group latitude/longitude data by user
  2. Repeat steps 3-7 for each user
  3. Map latitudes/longitudes points to x, y, z coordinates using spherical earth approximation
  4. Find the two furthest points as follows:
    • Initialize P1 to the center of mass of the points
    • Repeat the following 3 times (once is normally enough but multiple times handles corner cases):
      • Set P0 = P1
      • Set P1 = the point in points at maximum distance from P0
    • P0 and P1 are the furthest two points in x, y, z
  5. Use indexes of P0 & P1 to lookup latitude/longitude from original lat/log data
  6. Calculate the distance between P0 & P1 using Haversine
  7. Update results with the current user's distance
  8. Return results for all users as a data frame

Code

import numpy as np

def lat_lon_to_xyz(lat, lon):
    '''
        Convert latitude/longitude to x, y, z in Earth centered coordinates (assuming spherical earth)
        
        lat, lon are in degrees radian
        
        Source: https://stackoverflow.com/questions/1185408/converting-from-longitude-latitude-to-cartesian-coordinates
    '''
    lat_radians = np.deg2rad(lat)
    lon_radians = np.deg2rad(lon)
    
    R = 1  # use unit sphere rather than 6371 radius of earth in km 
    x = R * np.cos(lat_radians) * np.cos(lon_radians)
    y = R * np.cos(lat_radians) * np.sin(lon_radians)
    z = R *np.sin(lat_radians)
    
    return np.array([x, y, z])
    
def furthest_points_spadsman(points):
    '''
        Based upon the following technique which scales linearly with the number of points
        
        - Initialize P1 to the center of mass of the points
        - Repeat the following 3 times (once is normally enough but multiple times handles corner cases):
          - Set P0 = P1
          - Set P1 = the point in points with maximum distance from P0
          - P0 and P1 are the furthest two points in x, y, z
        
        Technique from following reference.
        Reference: https://stackoverflow.com/q/16865291/
    '''
    # Initialize to mean
    p_1 = np.mean(points, axis = 0)
    
    for _ in range(3): # Iterating mitigates corner cases
        p_0 = p_1
        # Point in points furthest distance from p_0
        # note: can use squared distance since monotonical
        p_1 = points[np.argmax(np.sum(np.square(points - p_0), axis = -1))]
    
    return p_0, p_1

def haversine(point1, point2):
    '''
        Data in point1 and point2 are latitude/longitude pairs, 
        with first number is the latitude (north-south), 
        and the second number is the longitude (east-west)
        
        Source: https://medium.com/@petehouston/calculate-distance-of-two-locations-on-earth-using-python-1501b1944d97
    '''
    R = 6371  # Earth radius in km
    
    point1 = np.deg2rad(point1)
    point2 = np.deg2rad(point2)
    
    delta = point2 - point1
    
    a = (np.sin(delta[0] / 2) ** 2 + 
         np.cos(point1[0]) * np.cos(point2[0]) * np.sin(delta[1] / 2) ** 2)
    
    return 2 * R * np.arcsin(np.sqrt(a))
    
def process(df, user = 'user', lat_field ='lat', lon_field = 'lon'):
    '''
        Generates the Dataframe containing the maximum distance by user of a set of points
        
        The process works as following steps.
        1.  Group latitude/longitude data by user
        2.  Repeat steps 3-7 for each user
        3.  Map latitudes/longitudes points to x, y, z coordinates using spherical earth approximation)
        4.  Find two furthest points as follows:
            i. calculate the center of mass M of the points
            ii. find the point P0 that has the maximum distance to M
            iii. find the point P1 that has the maximum distance to P0
            iv. P0 and P1 are the furthest two points in x, y, z
        5. Use indexes of P0 & P1 to lookup latitude/longitude from original lat/log data
        6. Calcualte distance between P0 & P1 using Haversine
        7. Update results
        8. Return results as a dataframe
        
         Process based upon following references:
         a. https://stackoverflow.com/questions/16865291/greatest-distance-between-set-of-longitude-latitude-points/16870359#16870359
         b. https://medium.com/@petehouston/calculate-distance-of-two-locations-on-earth-using-python-1501b1944d97
    
    '''
    results = []                              # holds list of tuples of (user, distance)
    for user_, g in df.groupby(user):            # Step 1--Group latitude/longitude data by user
        # Step 2--Repeat steps 2-4 for each user
        points_lat_lon = g[[lat_field, lon_field]].to_numpy()

        # Step 3--map latitudes/longitudes points to x, y, z coordinates
        points_xyz = lat_lon_to_xyz(points_lat_lon[:, 0], points_lat_lon[:, 1]).transpose()

        # Step 4--Find two furthest points
        # Find two furthest points in xyz (using spherical earth aproximation)
        p_0, p_1 = furthest_points_spadsman(points_xyz)
        
        # Step 5--Use indexes of P0 & P1 to lookup latitude/longitude from original lat/log data
        # Index of p_0 and p_1 in points_xyz (so we also corresponds to the index in points_lat_lon)
        index_0 = np.where(np.prod(points_xyz == p_0, axis = -1))[0][0]
        index_1 = np.where(np.prod(points_xyz == p_1, axis = -1))[0][0]

        lat_lon_0 = points_lat_lon[index_0, :]
        lat_lon_1 = points_lat_lon[index_1, :]
     
        # Step 6--Calcualte distance between P0 & P1 using Haversine
        distance = haversine(lat_lon_0, lat_lon_1)
        
        # Step 7--update results
        results.append((user_, distance))
    
    # Step 8--Return results as a dataframe
    return pd.DataFrame(results, columns = [user, 'Max_Distance_km'])

Tests

Test 1

Description

Computed maximum distance between cities in the United States

  • Used state id as user
  • Total 30, 409 records (multiple records per city and state)
  • Each record included state id, lat, long
  • Processing time for 30, 409 records: 0.104 seconds on 10+ year old windows desktop (i7 920 CPU @ 2.67GHz)

Dataset

  • Downloaded from this site: simplemaps
  • Contains many cities per state
  • Used state id as user (i.e. found max distances between cities by state)

Test Code

from time import time
import pandas as pd

# CSV file downloadable from https://simplemaps.com/data/us-cities
# Datafile with 30, 409 records
cities = pd.read_csv('simplemaps_uscities_basicv1.75/uscities.csv')

t0 = time()
result = process(cities, user = 'state_id', lat_field = 'lat', lon_field = 'lng')
print(f'Processing time: {time()-t0:.3f} seconds')
print(f'Results:\n{result}')

Output

Processing time: 0.104 seconds
Results:
   state_id  Max_Distance_km
0        AK      3586.855864
1        AL       569.292071
2        AR       492.544129
3        AZ       712.434590
4        CA      1321.284443
5        CO       697.572158
6        CT       182.286421
7        DC         0.000000
8        DE       156.778146
9        FL       936.595405
10       GA       589.700716
11       HI       574.129490
12       IA       538.297210
13       ID       825.044994
14       IL       622.014829
15       IN       496.787181
16       KS       682.563079
17       KY       633.576282
18       LA       601.891459
19       MA       301.815349
20       MD       397.753918
21       ME       509.556000
22       MI       743.578849
23       MN       751.324104
24       MO       707.260076
25       MS       534.872877
26       MT       961.640222
27       NC       778.308918
28       ND       582.080515
29       NE       763.370612
30       NH       249.275265
31       NJ       259.273945
32       NM       747.581138
33       NV       807.834661
34       NY       641.785757
35       OH       471.708115
36       OK       826.431505
37       OR       649.340103
38       PA       508.693319
39       PR       205.710138
40       RI        81.539958
41       SC       435.894534
42       SD       688.135798
43       TN       751.286457
44       TX      1240.972424
45       UT       611.262766
46       VA       729.361836
47       VT       285.877877
48       WA       616.073484
49       WI       570.813035
50       WV       441.834382
51       WY       682.873519

Test 2

Description

Find furthest distances traveled by animals in animal tracking data.

  • 126 different animal tags (e.g. users)
  • 89, 867 data records
  • Processed in 0.325 seconds

Dataset

  • Movebank is an online database of animal tracking data hosted by the Max Planck Institute of Animal Behavior.
  • Used Movebank dataset from Kaggle.
  • Data Source

Test Code

from time import time
import pandas as pd

# Data downloaded from above kaggle link
df = pd.read_csv('migration_original.csv/migration_original.csv')

t0 = time()
result = process(df, user = 'individual-local-identifier', lat_field = 'location-lat', lon_field = 'location-long')
print(f'Processing time: {time()-t0:.3f} seconds')
print(f'Results:\n{result}')

Output

Processing time: 0.325 seconds
Results:
    individual-local-identifier  Max_Distance_km
0                        91732A      7073.629785
1                        91733A        65.788571
2                        91734A      3446.277830
3                        91735A       231.789762
4                        91737A      5484.820693
..                          ...              ...
121                      91920A      2535.920902
122                      91921A        26.698255
123                      91924A        14.518173
124                      91929A         0.806871
125                      91930A        10.427890

[126 rows x 2 columns]

References

Acknowledgements

  • Thanks to @MangoNrFiv whose comments helped improve the implementation and testing.
General Grievance
  • 4,555
  • 31
  • 31
  • 45
DarrylG
  • 16,732
  • 2
  • 17
  • 23
  • I don't think, that the point furthest apart from the center of mass of all points is necessarily one of the two points that are furthest apart from each other. It makes intuitive sense and may work in most cases, but I can think about scenarios where it wouldn't hold up. – MangoNrFive Jul 14 '22 at 18:26
  • @MangoNrFive -- as an improvement I tried to continue iterating: 1) initialize with a point further from the center of mass and call it p_0,, 2) p_1 is the point further from it. 3) new p_0 is point further form p_1, 4) new p_1 is point further from p_0, etc. However, in my simulations with random points (thousands of lat/lon with small and wide spreads), there was no improvement (i.e. in finding a greater max distance) than what was provided by the initial p_0 & p_1. – DarrylG Jul 14 '22 at 19:08
  • As clarification for my comment before, one example. To make it easier just think about locations around the equator (0°N): a cluster of locations at 0°E; one location at 90°E; one location at 90°W; one location at 100°E. Your method would find the 100°E point and 90°W point when in fact it is the ones at 90°E and 90°W. – MangoNrFive Jul 14 '22 at 19:09
  • Yeah it seems like a very hard problem, but to transform into x, y, z-Coordinates and then calculating the distances directly not using haversine is a huge improvement by itself. So you have my vote for that suggestion alone. – MangoNrFive Jul 14 '22 at 19:12
  • @MangoNrFive -- Thanks for your feedback. I will look more into your example. This method allows you to use x, y, z to find the extreme points, then you Haversine on them to find the distance between the extreme points. But, I must give credit for the ideas to the references I mention in my writeup. – DarrylG Jul 14 '22 at 19:18
  • In the furthest_point-function you could just do: `np.max(np.sum(np.square(points - pt)))`. The shape of the lower dimensional pt-array gets [broadcasted](https://numpy.org/doc/stable/user/basics.broadcasting.html) to the higher dimensional points-array by numpy. – MangoNrFive Jul 14 '22 at 19:43
  • @MangoNrFive -- In this counter case you mentioned above equivalent to the following lats/lngs using decimal degrees: `data = {'lat':[0, 0, 0], 'lon':[-90, 90, 100], 'user':['a', 'a', 'a']}` For this case, it returns points with lon of +/-90 rather than -90, 100 (i.e. 90 W, 100 E). – DarrylG Jul 14 '22 at 19:54
  • @MangoNrFive -- on the suggestion of `np.max(np.sum(np.square(points - pt)))` -- won't thjis give me the value of the max distance from `pt` rather than the point in `points` with the max distance? – DarrylG Jul 14 '22 at 19:58
  • You're missing the cluster of points at 0°E, 0°N, just add 2 points with those coordinates that should be enough – MangoNrFive Jul 14 '22 at 19:59
  • You're right with the point about just calculating the distance and not getting the actual point. I think you can take a look at np.argmax then, that returns the index and not the value. – MangoNrFive Jul 14 '22 at 20:04
  • Let us [continue this discussion in chat](https://chat.stackoverflow.com/rooms/246444/discussion-between-darrylg-and-mangonrfive). – DarrylG Jul 14 '22 at 20:04
1

Are you OK with cartesian distance instead of great-circle distance? They should be very similar for nearby points on the scale you're describing.

If so, convert lat/lon to ECEF (earth centered earth fixed) cartesian coordinates as described on page 4 of this paper. Then, for each user's set of ECEF position vectors, the distance between the two furthest points is given in O(n) time by Megiddo's 1983 smallest enclosing sphere algorithm.

Also, Welzl's algorithm could probably be applied in spheroidal coordinates if great-circle distance is necessary, but that seems a rather large undertaking.

Edit: More strictly speaking, the diameter of the enclosing sphere provides an upper bound on the distance between the two furthest points, and the distance between the two furthest of the set of points on the sphere provides a lower bound.

If only two points lie on the sphere, these must be antipodal and are necessarily the furthest apart. Otherwise, the search space of possible pairs can then be narrowed by removing any points which are not far enough from the sphere's center to be part of the maximally separated pair (based on the lower bound previously determined), but the reduced space must then be evaluated by another method.

Jeremy
  • 136
  • 1
  • 5
  • 1
    Note that the points on the enclosing sphere aren't necessary members of the pair which are furthest apart. Say the closing sphere is defined by the points of a equilateral triangle, than we can place two point within that sphere, of (almost) 2 radius apart. – Willem Hendriks Aug 02 '22 at 09:09
  • Edited to address the well made point above. I believe it is precisely correct now, but I could be mistaken. Thanks @WillemHendriks, please comment again if you have further input. :-) – Jeremy Aug 02 '22 at 22:59
  • Indeed! Your idea probably already works well enough in practice, to immediately throw an exhaustive search on the reduced space. And even better if you relax the condition from on the sphere to the N points most close by. Creative! – Willem Hendriks Aug 03 '22 at 06:18
1

On this answer one will find two potential options:

  • Option 1, using a function that I created on my answer here. On that answer one will find additional methods that one could use.

  • Option 2, using a different function.

For testing purposes, even though I recommend testing with data as close to what one will be using as possible, I will take the example proposed by @Qdr

import pandas as pd
import numpy as np
import random as rn

data = [[rn.randint(1, 10), rn.randint(1, 10)] for x in range(9)]
users = ['user1', 'user2', 'user3'] * 3
rn.shuffle(users)

df1 = pd.DataFrame(data, columns=['x', 'y'], index=users)

Option 1

In order to measure the distance between two points (represented by geographic coordinates), as I referred above, one can use one of the function I shared here, where we will find a better explanation.

The function is called haversine, and is inspired by the haversine formula.

def haversine(lon1, lat1, lon2, lat2):
    """
    Calculate the great-circle distance (in km) between two points 
    using their longitude and latitude (in degrees).
    """
    # Radius of the Earth
    r = 6371.0

    # Convert degrees to radians 
    # First point
    lat1 = radians(lat1)
    lon1 = radians(lon1)

    # Second Point
    lat2 = radians(lat2)
    lon2 = radians(lon2)

    # Haversine formula 
    dlon = lon2 - lon1 
    dlat = lat2 - lat1 
    a = sin(dlat / 2)**2 + cos(lat1) * cos(lat2) * sin(dlon / 2)**2
    c = 2 * atan2(sqrt(a), sqrt(1 - a)) 
    return r * c

As one wants the max distance, let's create a function that uses the previous one

def max_distance(lat1, lon1, lat2, lon2):
    # Calculate distance between two points
    distance = haversine(lon1, lat1, lon2, lat2)
    # Return max distance
    return np.max(distance)

Finally, one can create a new dataframe, df2.

[In]: df2 = df1.groupby(df1.index).apply(lambda x: pd.Series({'max_distance': max_distance(x['x'].iloc[0], x['y'].iloc[0], x['x'].iloc[1], x['y'].iloc[1])}))
[Out]:       max_distance
user1    866.714728
user2    867.428750
user3    247.358878

Option 2

Depending on one's requirements, the following function can also be used to , assuming one wants to calculate the max distance between two points, the following function does the work

def max_distance(lat1, lon1, lat2, lon2):
    # Calculate distance between two points
    distance = np.sqrt((lat1 - lat2)**2 + (lon1 - lon2)**2)
    # Return max distance
    return np.max(distance)

In order to create the new dataframe, grouped by users (in this example it is the index of the dataframe df1), with a column named max_dist_km that will have the max distance between two points for a given user (using the previous function), the following should do the work

df2 = df1.groupby(df1.index).apply(lambda x: pd.Series({'max_distance': max_distance(x['x'].iloc[0], x['y'].iloc[0], x['x'].iloc[1], x['y'].iloc[1])}))
Gonçalo Peres
  • 11,752
  • 3
  • 54
  • 83
  • Thank you ! I'm a bit confused by this. In the "max_distance" function that you define, is lat1 (and the other variables) supposed to be arrays or scalars ? My understandinc is that it's scalars, but then I'm not sure what the np.max does here. – mlx Jul 13 '22 at 09:54
  • @mlx you might want to check the option 1 that I just shared. It uses an implementation of the Haversine Formula. – Gonçalo Peres Jul 13 '22 at 20:12
0

you could use distance_matrix in scipy

first create dataframe with random values and 3 users

import pandas as pd
from scipy.spatial import distance_matrix
import random as rn

    
data = [[rn.randint(1, 10), rn.randint(1, 10)] for x in range(9)]
users = ['user1', 'user2', 'user3'] * 3
rn.shuffle(users)

df = pd.DataFrame(data, columns=['x', 'y'], index=users)
df
x y
user2 9 7
user2 5 4
user3 3 10
user1 8 3
user1 5 7
user1 8 5
user2 10 2
user3 3 9
user3 2 2

then groupby and apply distance_matrix

df.groupby(df.index).apply(lambda x: distance_matrix(x, x).max())

output:

user1    5.000000
user2    5.385165
user3    8.062258
dtype: float64
Qdr
  • 703
  • 5
  • 13
0

This approach is using pandas groupby, in combination with sklearn spatial function. It is fairly fast (about same as @DarrylG).

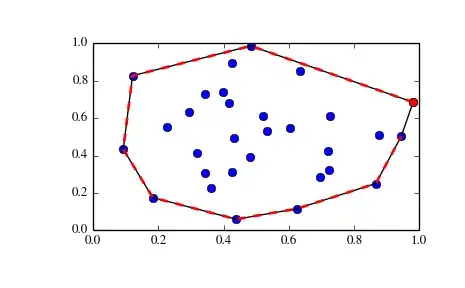
We define a custom groupby function, using Convex Hull to extract edge points within a group, and calculate the max distance, using Distance Metric Haversine.

The idea is that the maximum distance can sharply be approximated by only consider the edges of the Convex Hull. There are edge-cases where this falls short due to abusing it for lat/long pairs.

ConvexHull

import pandas as pd
import numpy as np

from sklearn.metrics import DistanceMetric
from scipy.spatial import ConvexHull

from math import radians

dist = DistanceMetric.get_metric('haversine')

def max_distance_within_group(df):
    
    EARTH_RADIUS = 6371.009
    
    group_gps = df[['location-lat','location-long']].values
    
    if len(group_gps) > 10:
        """
            If more than 10 point, lets create a convex-hull,
            and only use the edge points.
        """
        convex_hull_idx = ConvexHull(group_gps)
        group_gps = group_gps[convex_hull_idx.vertices]

    haversine_distances = dist.pairwise(np.radians(group_gps))
    haversine_distances *= EARTH_RADIUS

    return np.max(haversine_distances)

I use the same 2nd test case of @DarrylG so you can compare speed if you like. Our speeds are so similar than I can't tell which is faster.

migration = pd.read_csv('work/migration_original.csv')

And apply

migration.groupby('individual-local-identifier').apply( max_distance_within_group )

which returns

individual-local-identifier
91732A    7073.639777
91733A      65.788664
91734A    3446.282699
91735A     231.790090
91737A    5484.828441
             ...     
91920A    2535.924485
91921A      26.698292
91924A      14.518194
91929A       0.806872
91930A      10.427905
Length: 126, dtype: float64
Willem Hendriks
  • 1,267
  • 2
  • 9
  • 15