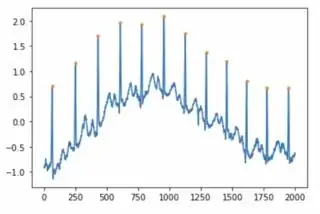
I can easily get scipy.signal.find_peaks to plot peaks (example from the documentation):
import matplotlib.pyplot as plt
from scipy.misc import electrocardiogram
from scipy.signal import find_peaks

x = electrocardiogram()[2000:4000]

peaks, _ = find_peaks(x, distance=150)
np.diff(peaks)

plt.plot(x)
plt.plot(peaks, x[peaks], '.')
plt.show()
And getting the values of peaks is also easy:
But how can I plot x[peaks] either in place of the dot or nearby?
I had expected plt.plot(peaks, x[peaks], x[peaks]) would have worked, but no.


