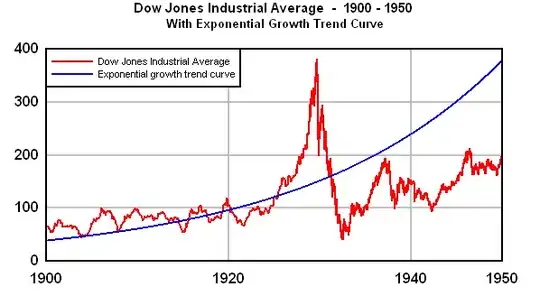
I need to be able to extrapolate, using 2-n data points, a curved trend line which can then be 'queried'. In my head it would look a bit like this (the blue line):

This is for a 'calories calculator' - I have data points regarding the amount of calories burned for an activity based on a certain weight: e.g. if you're 65kg, you'll burn around 420 calories, if you're 70kg, you'll burn 480 calories, if you're 75kg, you'll burn 550 calories, etc. etc. One axis would be for calories, the other for weight.
Obviously if I wanted to find out the amount of calories burned for a weight where I don't have a data point, I would need a trend line to 'query', which brings me on to the second part of my question: how would I go about doing this?
In summary:
- How do I extrapolate a trend line in Python?
- How do I 'query' this trend line to get estimates based on a point on this trend line?