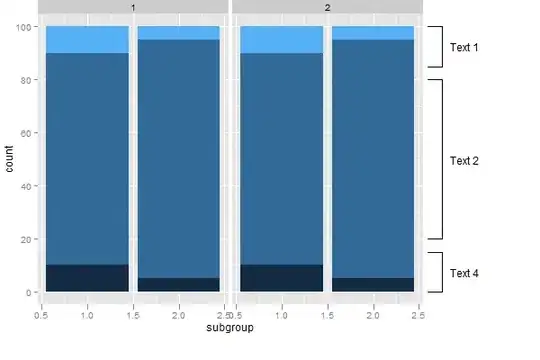
I am trying to do a relative abundance bar plot, but the bars in the graph have no colors despite the legends having the colors. Below is the script that I used. Kindly assist. I have pasted a photo of how the graph looks like.
library(phyloseq)
library(vegan)
library(ggplot2)
require(vegan)
library(gplots)
library(dplyr)
library(scales)

##create the phyloseq object (I just give the basic command here, but don't forget to rarefy)

table = read.table (file.choose(), header = TRUE, row.names = 1 , sep = ",")
taxonomy = read.table (file.choose(), header = TRUE, row.names = 1 , sep = ",")
metadata = read.table (file.choose(), header = TRUE, row.names = 1 , sep = ",")

physeq_OTU = otu_table(as.matrix(table), taxa_are_rows = T)
physeq_tax = tax_table(as.matrix(taxonomy))
physeq_metadata = sample_data(metadata)

physeq <- phyloseq(physeq_OTU, physeq_tax, physeq_metadata)

physeq_Archaea<- subset_taxa(physeq, Kingdom=="d__Archaea")
physeq_Bacteria<- subset_taxa(physeq, Kingdom=="d__Bacteria")

Archaea=subset_taxa(physeq, Kingdom=="d__Archaea")
Bacteria=subset_taxa(physeq, Kingdom=="d__Bacteria")

#subset to phylum table for the specimens of interest
Phylum_Archaea = tax_glom(Archaea, taxrank = "Phylum")

#create dataframe from phyloseq object
data_glom<- psmelt(Phylum_Archaea)

#convert to character
data_glom$Phylum <- as.character(data_glom$Phylum)

#rename genera with <1% abundance
data_glom$Phylum[data_glom$Abundance < 0.01] <- "<1% abundance"

write.csv(data_glom, file="data_glom_Archaea.csv")

#Count #genera to set colour palette
Count = length(unique(data_glom$Phylum))
Count

#To change order of Archaea, use factor() to change order of levels
#maybe you want to put the most abundant taxa first
#Use unique(data_glom$class) to see exact spelling of each phylum
unique(data_glom$Phylum)
data_glom$Phylum <- factor(data_glom$Phylum, levels = c("p__Halobacterota",
"p__Thermoplasmatota", "p__Nanoarchaeota", "p__Crenarchaeota", "< 1% abund."))

 Barplot <- ggplot(data=data_glom, aes(x=location, y=Abundance, fill = Phylum))
 Barplot2 = Barplot + geom_bar(aes(), stat="identity", position ="fill", color = "black") +
 scale_fill_manual(values = c("p__Halobacterota" = "green", "p__Thermoplasmatota" =
 "aquamarine", "p__Nanoarchaeota" = "goldenrod1", "p__Crenarchaeota" = "violetred1", "< 1%
 abund." = "dark cyan")) +
 theme(legend.position="right") +
 guides(fill=guide_legend(nrow=6)) +
 theme(text = element_text(size = 10)) +
 theme(axis.text.x=element_text(angle=90, hjust=1)) +
 scale_y_continuous(labels = scales::percent_format(scale = 100))+ theme_classic()