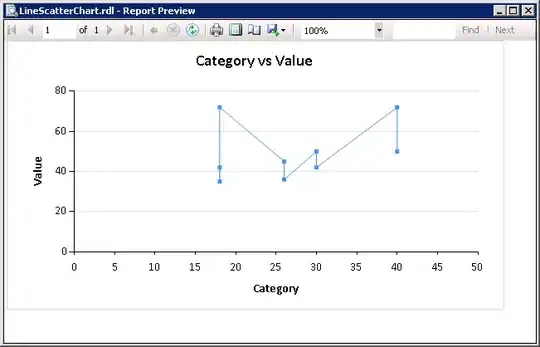
I was wondering if I could get some help figuring out how to display the quantity of each bar when hovering over them. I made a bar chart to display shot frequency by shot type
 bones_count <- bones_22 %>%
  mutate( n = length(unique(typeAction))) %>%
  plot_ly( x = ~typeAction, y = ~n,
           hoverinfo = ~n)
  add_bars() %>%
  hide_guides()
If I convert to a tibble, n is 29 for all rows. I manually checked the quantities in my chart and they are accurate but I would like the actual quantities to display instead of 29, any suggestions would be greatly appreciated.

