I'm doing some data analysis for an organization and I'm trying to change the order of the bars in a bar chart. Right now, it is ordered alphabetically but I want to set it to the order of days in a week. I have tried using levels and factor, but I don't think it is working possibly because I am reading the data in from an excel file and each column is the sum of all values of that day. Is there a way to do this through ggplot2 without editing the original excel file?
Asked
Active
Viewed 387 times
0
-
1An ordered factor is the standard way to do this and there are a bunch of answers on this site that demonstrate how to do that. It will be easier to help if you review those and can share some specific code that isn't working. – Jon Spring Aug 17 '22 at 22:30
-
The idea is `ggplot(df, aes(factor(x = day_of_week))) + geom_bar() + scale_x_discrete(limits=c('Mon', 'Tue', 'Wed', 'Thu', 'Fri', 'Sat', 'Sun'))` But posting your code will help – Sweepy Dodo Aug 17 '22 at 23:15
-
Please see the **newer** answers in the linked duplicate question. – neilfws Aug 17 '22 at 23:59
1 Answers
0
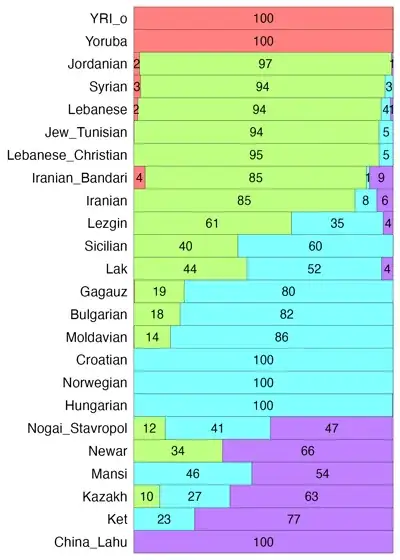
Basically do something like ggplot(df,aes(x=factor(V1,level=unique(V1)),y=V3,fill=V2)) (or add fct_rev to reverse the order):
t=read.table("https://pastebin.com/raw/GyEiXxNs",r=1)
t=t[,c(4,1,3,2)]
colnames(t)=paste0("V",1:ncol(t)) # prevent ggplot from reordering the bars for each column
t=t[order(as.matrix(t)%*%(1:ncol(t))^2),] # reorder rows so that rows with a high percentage of the first column are placed first

w2l=function(x)data.frame(V1=rownames(x)[row(x)],V2=colnames(x)[col(x)],V3=unname(c(unlist(x))))
t2=w2l(t) # wide to long

lab=round(100*t2$V3)
lab[lab<=1]="" # don't display labels for 0% or 1%

ggplot(t2,aes(x=fct_rev(factor(V1,levels=unique(V1))),y=V3,fill=V2))+
geom_bar(stat="identity",width=1,position=position_fill(reverse=T),size=.1,color="gray10")+
geom_text(aes(label=lab),position=position_stack(vjust=.5,reverse=T),size=3.5)+
coord_flip()+
scale_x_discrete(expand=c(0,0))+
scale_y_discrete(expand=c(0,0))+
scale_fill_manual(values=colorspace::hex(colorspace::HSV(head(seq(0,360,length.out=ncol(t)+1),-1),.5,1)))+
# ggh4x::force_panelsizes(cols=unit(3,"in"))+ # make bars always 3 inches wide
theme(
  axis.text=element_text(color="black",size=11),
  axis.text.x=element_blank(),
  axis.ticks=element_blank(),
  axis.title=element_blank(),
  legend.position="none",
  panel.border=element_rect(color="gray10",fill=NA,size=.2)
)

ggsave("1.png",width=4.5,height=.25*nrow(t)+.3,limitsize=F)
nisetama
- 7,764
- 1
- 34
- 21