3

I really like the possibilities this package offers and would like to use it in a shiny app. however i am struggling to recreate a plot from ggplot to echarts4r

  library(tidyverse)
  library(echarts4r)

  data = tibble(time = factor(sort(rep(c(4,8,24), 30)), levels = c(4,8,24)),
                dose = factor(rep(c(1,2,3), 30), levels = c(1,2,3)),
                id = rep(sort(rep(LETTERS[1:10], 3)),3),
                y = rnorm(n = 90, mean = 5, sd = 3))

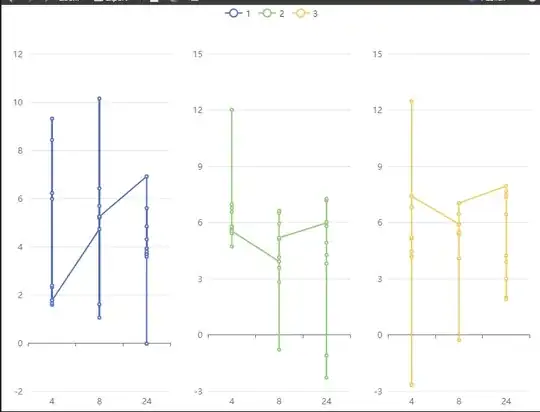
This is the plot i am aiming to recreate:

ggplot(data = data, mapping = aes(x = time, y = y, group = id)) + 
geom_point() + 
geom_line() + 
facet_wrap(~dose)

image

The problem i am having is to make groups of my data using group = id in ggplot syntax in echarts4r . I am aiming to do e_facet on grouped data using group_by() however i can not (or dont know how to) add a group to connect the dots using geom_line()

data %>% 
group_by(dose) %>% 
e_charts(time) %>%
e_line(y) %>%
e_facet(rows = 1, cols = 3)

image

  • 2
    It looks to me like that's not possible. The documentation for `e_facet()` says it draws each series in a separate facet, but to match the ggplot version you'd need multiple series per facet. – Mikko Marttila Sep 14 '22 at 14:46
  • @MikkoMarttila this is what i suspected but thank you for taking the time to read the documentation – Hugo van Kessel Sep 15 '22 at 06:54

1 Answers1

0

You can do this with echarts4r.

There are two methods that I know of that work, one uses e_list. I think that method would make this more complicated than it needs to be, though.

It might be useful to know that e_facet, e_arrange, and e_grid all fall under echarts grid functionality—you know, sort of like everything that ggplot2 does falls under base R's grid.

I used group_split from dplyr and imap from purrr to create the faceted graph. You'll notice that I didn't use e_facet due to its constraints.

group_split is interchangeable with base R's split and either could have been used.

I used imap so I could map over the groups and have the benefit of using an index. If you're familiar with the use of enumerate in a Python for statement or a forEach in Javascript, this sort of works the same way. In the map call, j is a data frame; k is an index value. I appended the additional arguments needed for e_arrange, then made the plot.

library(tidyverse) # has both dplyr and purrrrrr (how many r's?)
library(echarts4r)

data %>% group_split(dose) %>% 
  imap(function(j, k) {
    j %>% group_by(id) %>% 
      e_charts(time, name = paste0("chart_", k)) %>% 
      e_line(y, name = paste0("Dose ", k)) %>%
      e_color(color = "black")
  }) %>% append(c(rows = 1, cols = 3)) %>% 
  do.call(e_arrange, .)

enter image description here

Kat
  • 15,669
  • 3
  • 18
  • 51