UPDATE
The below process may be suitable for your needs, but you may prefer to avoid making manual changes, by using a different approach:
jQuery datatable export to excel with cell() background color
This approach does not require manual file editing.
ORIGINAL ANSWER
Looking at your comment:
"how to add new styles by modifying "xl/styles.xml" section in “buttons.html5.js” file, tried with many ways but no success"
Here is a step-by-step guide to how I edited my local copy of the buttons.html5.js file to add a new custom style.
I first went to the DataTables download page and downloaded the files I need.
I used the related script tags in the <head> section of the page - for example:
<script type="text/javascript" src="buttons/Buttons-2.2.3/js/buttons.html5.js"></script>
And I made sure my files were in the expected location relative to my HTML file containing my DataTable.
- I edited my
buttons.html5.js file as follows... You need to get this exactly right...
What I will do in the next steps is:
- add one new font style to define a new font color (a shade of green).
- add one new fill style to define a new cell background color (a shade of yellow).
- add one new cell formatting style which uses the above colors.
- I added one new font to the
<fonts> section, at the end:
            '<fonts count="6" x14ac:knownFonts="1">'+
                '<font>'+
                    '<sz val="11" />'+
                    '<name val="Calibri" />'+
                '</font>'+
                '<font>'+
                    '<sz val="11" />'+
                    '<name val="Calibri" />'+
                    '<color rgb="FFFFFFFF" />'+
                '</font>'+
                '<font>'+
                    '<sz val="11" />'+
                    '<name val="Calibri" />'+
                    '<b />'+
                '</font>'+
                '<font>'+
                    '<sz val="11" />'+
                    '<name val="Calibri" />'+
                    '<i />'+
                '</font>'+
                '<font>'+
                    '<sz val="11" />'+
                    '<name val="Calibri" />'+
                    '<u />'+
                '</font>'+

                // added font ID 5:
                '<font>'+
                    '<sz val="11" />'+
                    '<name val="Calibri" />'+
                    '<color rgb="FF548235" />'+
                '</font>'+

            '</fonts>'+
- I incremented the related count (at the top of that section) from
count="5" to count="6".
That RGB string FF548235 represents the color 548235, which is a shade of green, with an alpha channel of FF (meaning opaque). Note how the FF of the alpha channel comes before the RGB code.
- I repeated the process for the
<fills> section, adding one new fill color:
            '<fills count="7">'+
                '<fill>'+
                    '<patternFill patternType="none" />'+
                '</fill>'+
                '<fill>'+ // Excel appears to use this as a dotted background regardless of values but
                    '<patternFill patternType="none" />'+ // to be valid to the schema, use a patternFill
                '</fill>'+
                '<fill>'+
                    '<patternFill patternType="solid">'+
                        '<fgColor rgb="FFD9D9D9" />'+
                        '<bgColor indexed="64" />'+
                    '</patternFill>'+
                '</fill>'+
                '<fill>'+
                    '<patternFill patternType="solid">'+
                        '<fgColor rgb="FFD99795" />'+
                        '<bgColor indexed="64" />'+
                    '</patternFill>'+
                '</fill>'+
                '<fill>'+
                    '<patternFill patternType="solid">'+
                        '<fgColor rgb="ffc6efce" />'+
                        '<bgColor indexed="64" />'+
                    '</patternFill>'+
                '</fill>'+
                '<fill>'+
                    '<patternFill patternType="solid">'+
                        '<fgColor rgb="ffc6cfef" />'+
                        '<bgColor indexed="64" />'+
                    '</patternFill>'+
                '</fill>'+

                // added fill ID 6:
                '<fill>'+
                    '<patternFill patternType="solid">'+
                        '<fgColor rgb="ffffc000" />'+
                        '<bgColor indexed="64" />'+
                    '</patternFill>'+
                '</fill>'+

            '</fills>'+
The fill color is ffffc000, which is ff for the alpha channel, followed by the RGB code of ffc000 - which is a shade of darker green.
- As with the fonts section, I incremented the related count (at the top of that section). This time, it changed from count="6" to count="7".
NOTE that the font ID and fill ID are 1 less than the total count, because the IDs start at zero - so that is why the 7th <fill> has an ID of 6.
You do not provide these IDs in the XML. Excel determines the IDs based on the position of the font (or fill) within the overall fonts (or fills) list.
But you need to know the correct ID numbers so you can use them in the next step...
- I added a new style at the end of the
<cellXfs> section:
                // added xf ID 68:
                '<xf numFmtId="0" fontId="5" fillId="6" borderId="0" applyFont="1" applyFill="1" applyBorder="1"/>'+
This is where I use the font and fill IDs: fontId="5" fillId="6".
- I also needed to increment the overall style count from
count="68" to count="69".
After saving all the above changes, I can now use that new style - which is style ID 68.
I used the code from your question for this:
var table = $('#example').DataTable( {
  dom: "Brftip",
  buttons: [{
    extend: 'excelHtml5',
    customize: function(xlsx) {
        var sheet = xlsx.xl.worksheets['sheet1.xml'];

        $('row c', sheet).each( function () {
            // Get the value
            if ( $('is t', this).text() == 'New York' ) {
                $(this).attr( 's', '68' );
            }
        });
    }
  }]
} );
Note the attr( 's', '68' ) above.
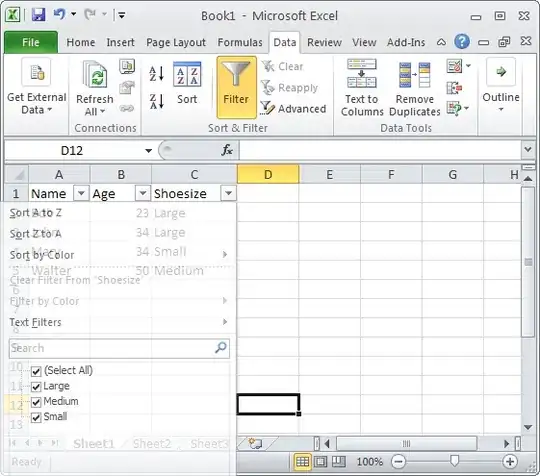
Using my test data, this generates the following:
The big downside with this approach is that you have manually edited the DataTables JavaScript - and those changes will be lost when you upgrade DataTables to a newer version. You will have to repeat the above edits.
You can avoid this by automating these edits in your DataTable's JavaScript code using customize: function( xlsx ).
That function gives you access to the Excel object (xlsx) inside which all the spreadsheet's data and styles are stored.
That is a larger, more complicated programming task.
But if you are interested, you can see an example showing a similar approach here: JQuery Datatable Excel export number format and also in various other questions on Stack Overflow.
