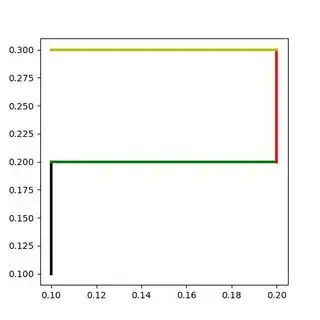
It's all in the title. I'm trying to plot a grid in python, with a specific color for each edge. Here is a view of what I would like to obtain, made from tikz.
The tikz code gives me a roadmap for how to proceed in python: I just run two loops of coordinates and draw by hand the edge (x, y)--(x+1,y).
I see two ways of implementing this in python, but can't find the exact syntax/objects/packages to use (most of the time, people just call the grid functions, in which the axis can be given a color, but this is quite different):
- is there a way to access the specific edges using the grid function ? If so, how are they indexed ?
- or is there a way to draw by hand, the segment (0,0) to (0,1) and the segment (0,1) to (0,2) and plot them in the same graph, side by side ?
Thanks !

