0

When I used the MODIS data,I got a problem about the Type.

I got the coord by xarray(python 3.9),but I couldn't get the same type as 'GEO2D'.

xr_tmp = xr.Dataset(
{
    'Gpp_500m'      :  (('XDim', 'YDim','time'), Gpp_500m),
    'Npp_500m'      :  (('XDim', 'YDim','time'), Npp_500m),
    'Npp_QC_500m'   :  (('XDim', 'YDim','time'), Npp_QC_500m),
},
coords=dict(
    lon = (['XDim', 'YDim'],lon),
    lat = (['XDim', 'YDim'],lat),
    time = _time_
    # 'latitude': lat,
    # 'longitude': lon,
    # 'time': _time_,
)
)

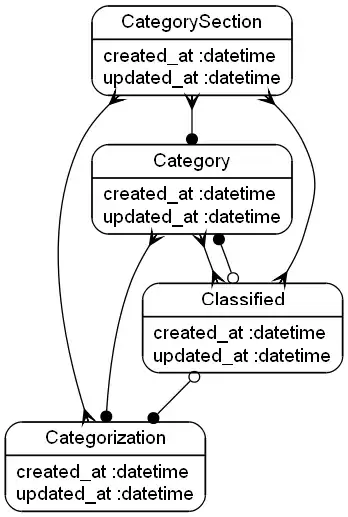
The figures are shown bellow,Could U help me? (use xarray or pyModis if necessary)

enter image description here

enter image description here

You can see the difference from the pictures as follow.

enter image description here enter image description here

马希仁
  • 1
  • 1
  • I don't know what Geo2D is - can you please clearly describe exactly what format you are looking for? – Michael Delgado Oct 12 '22 at 05:12
  • Thanks for your comment, I add another two pictures in my qustion. I don't know if that will help you understand it. The '2D' type in Panoply shows just the value, while the 'GEO2D' type shows the value and the coordinates at the same time. – 马希仁 Oct 12 '22 at 09:28
  • I believe your question is : "what should I do to make Panoply recognize `lon` and `lat` as georeferenced fields", isn't it ? – cyril Oct 13 '22 at 12:14
  • Yep,that is.Thanks for your explanation. – 马希仁 Oct 14 '22 at 01:45
  • are you saving as a netCDF? you might get more luck adding the `netCDF` and/or `netCDF4` tags to get help from that community. sorry I don't have any idea how to format data for panoply. – Michael Delgado Oct 14 '22 at 04:22
  • In h00v08.ncml.nc4, Longitude and Latitude probably have attributes that are useful for panoply's understanding. In panoply, just click on one of these two, and there's a panel in the right displaying its attributes. – cyril Oct 14 '22 at 10:02
  • Thanks for both of you for your help. I have solved the problem by the following code – 马希仁 Oct 19 '22 at 14:52
  • `xr_tmp = xr.Dataset( {VarName: (('XDim', 'YDim', 'time'), locals()[VarName]),}, coords=dict( lon=(['XDim', 'YDim'], _lon_), lat=(['XDim', 'YDim'], _lat_), XDim=_XDim_, YDim=_YDim_, time=_time_,) )` – 马希仁 Oct 19 '22 at 14:54
  • so sorry for the terrible forma.This is the first time for me to ask question on the stackoverflow. The highleight in the code is that I need to use 'Xdim' and 'YDim' to support 'lat' and 'lon' because they are 2Dims. – 马希仁 Oct 19 '22 at 15:00
  • By the way, it doesn't mean that the data can be displayed as 'GEO2D' in panoply but the attributes of the 'lat' abd 'lon' can operate as 'GEO2D'. You can use the function like 'merge' , 'mf_opendataset' and so on. – 马希仁 Oct 19 '22 at 15:04

0 Answers0