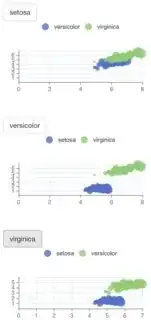
Here's a question for RShiny users. I have developed an application which has multiple routes on rendering UI, through action buttons, dropdowns and graph click events. My goal is to fully modularise the application.
The problem I am having with modularisation is using echarts4r e_on("click") functionality in a dynamically rendered UI. As an example of minimal working code (which reflects the process at the moment), I've used the dataset iris:
library(shiny)
library(DT)
library(echarts4r)


ui <- fluidPage(
  fluidRow(br(),
           br(),
           actionButton("example_button", "Click button to see table"),
           echarts4rOutput("example_plot"),
           dataTableOutput("table_example"))
)


server <- function(input, output, session) {

  group <- reactiveVal(iris)

  output$example_plot <- renderEcharts4r({

    iris %>%
      group_by(Species) %>%
      e_charts(Sepal.Length) %>%
      e_scatter(Petal.Length, Sepal.Width) %>%
      e_on(
        "click",
        "function(){
          Shiny.setInputValue('example_plot_on_click', true, {priority: 'event'});
        }"
      )

    })

  observeEvent(input$example_plot_clicked_serie, {

    group(filter(iris, Species == input$example_plot_clicked_serie))

  })

  output$table_example <- renderDataTable({

    group()


  })


}

shinyApp(ui, server)
Essentially, an echarts is rendered, a point is clicked and then fed into a reactive value. In this case, when you click on a species, it filters the Iris dataset for that species and displays in the DT Table. I'm not an expert at all in JS, but managed to get this working through shiny.setInputValue. In my app, the action buttons serve a similar purpose (i.e. filtering the table), but that is working so I've not included in the example code here. To put in context, this ui and server appears in multiple modal pop-ups, and include different buttons and charts for different groups (but the process for each of the modals is the same). Each button and chart (50-60 of these combo's across the app) all currently have an individual calls:
  output$setosa_plot <- renderEcharts4r({

    iris %>%
      filter(Species == "Setosa") %>%
      e_charts(Sepal.Length) %>%
      e_scatter(Petal.Length, Sepal.Width) %>%
      e_on(
        "click",
        "function(){
          Shiny.setInputValue('setosa_plot_on_click', true, {priority: 'event'});
        }"
      )

    })

  observeEvent(input$setosa_plot_clicked_serie, {

    group(filter(iris, Species == input$setosa_plot_clicked_serie))

  })
In order to modularise, I'm intending to dynamically render the action button and echart (so each modal can share the same code). I have got the dynamic rendering working, and as an example, i've rendered a button and a chart for each species. The issue I am having is I can't access the click event as I do in the above example. I cannot find a solution, I've tried different methods. I essentially need to return the "species" that is clicked in any of those graphs to use in my filtering function.
ui <- fluidPage(
  fluidRow(br(),
           br(),
           uiOutput("buttons_and_charts"),
           dataTableOutput("table_example"))
)


server <- function(input, output, session) {

  group <- reactiveVal(iris)


  output$buttons_and_charts <- renderUI({

    group_list <- unique(iris$Species)

    test <- list()

    for(i in unique(sort(group_list))){


      test[[i]] <- fluidRow(actionButton(paste0(tolower(i), "_button"), i),
                            iris %>%
                              group_by(Species) %>%
                              e_charts(Sepal.Length) %>%
                              e_scatter(Petal.Length, Sepal.Width) %>%
                              e_on(
                                "click",
                                "function(){ Shiny.setInputValue('example_plot_on_click', true, {priority: 'event'});
                                }"
                              )
      )
    }

    test

  })


  observeEvent(input$example_plot_clicked_serie, {

    group(filter(iris, Species == input$example_plot_clicked_serie))

  })

  output$table_example <- renderDataTable({

    group()


  })


}

shinyApp(ui, server)
I'm not sure whether this is even possible, but it would be good to know nonetheless! Thanks in advance.

