How can I edit the legend for the patterns while leaving the other legend as is when using ggpatterns?
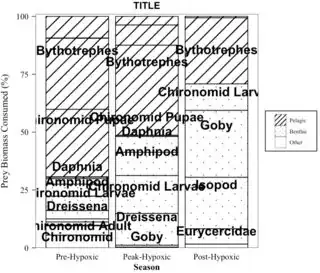
I used the following code to make this plot:
ggplot(try2, aes(Season, prey_frq, fill=PreyName, pattern = Type)) +
  geom_bar_pattern(stat = "identity",
                   pattern_fill = "black",
                   pattern_color = "black",
                   pattern_angle = 45,
                   pattern_density = 0.04,
                   pattern_spacing = 0.04,
                   pattern_key_scale_factor = 0.6) +
  geom_text(data = subset(try2, prey_frq>3),
            aes(y = pos_label,
                label = PreyName), face = "bold", size = 7) +
  scale_pattern_manual(values = list,
                       c('Other' = 'none', 'Pelagic' = 'stripe', 'Benthic' = 'circle')) +
  ggtitle("TITLE") +
  labs(x="Season", fill = "Prey Name", y = "Prey Biomass Consumed (%)") +
  scale_fill_igv(palette = "default") +
  guides(pattern = guide_legend(
    title = "Type",
    #direction = "horizontal",
    title.position = "top",
    label.position = "right",
    label.hjust = 0.5,
    label.vjust = 1
    #label.theme = element_text(angle = 90)
    , override.aes = list(fill = "white"), order = 2),
    fill = guide_legend(override.aes = list(pattern = "none", order = 1))) +
  theme_bw() +
  theme(legend.position = "right",
        plot.title = element_text(hjust=0.5, face = "bold", family = "Arial",
                                  size=15),
        legend.background = element_rect(fill = "white", color = 1),
        legend.title.align = 0.5,
        legend.title = element_text(face = "bold"),
        axis.title.y = element_text(size = 15,
                                    margin = margin(t = 0, r = 10, b = 0, l = 0),
                                    color = "black"),
        axis.title.x.top = element_text(size = 14,
                                        margin = margin(t = 0, r = 0, b = 10, l = 0),
                                        color = "black"),
        text = element_text(family = "Times New Roman"),
        axis.text.y = element_text(color = "black",
                                   size = 13,
                                   angle = 0,
                                   vjust = 0.5,
                                   hjust = 1,
                                   margin = margin(t = 0, r = 5, b = 0, l = 0)),
        axis.text.x = element_text(color = "black",
                                   size = 13,
                                   angle = 0,
                                   vjust = 1.5,
                                   hjust = 0.5,
                                   margin = margin(t = 5, r = 0, b = 0, l = 0)),
        axis.title.x = element_text(size = 14,
                                    face = "bold"),
        axis.ticks.x = element_blank(),
        plot.background = element_blank(),
        panel.grid.major = element_blank(),
        panel.grid.minor = element_blank(),
        axis.ticks.length = unit(0.2,"cm")) +
  scale_y_continuous(expand = expansion(mult = c(0,0.01)))
My data:
structure(list(Season = structure(c(1L, 1L, 1L, 1L, 1L, 1L, 1L,  1L, 1L, 1L, 1L, 1L, 1L, 1L, 1L, 1L, 1L, 1L, 2L, 2L, 2L, 2L, 2L,  2L, 2L, 2L, 2L, 2L, 2L, 3L, 3L, 3L, 3L, 3L, 3L, 3L), levels = c("Pre-Hypoxic", "Peak-Hypoxic", "Post-Hypoxic"), class = "factor"), PreyName = structure(c(1L,  2L, 3L, 4L, 5L, 6L, 7L, 8L, 9L, 10L, 12L, 13L, 14L, 16L, 17L,  18L, 19L, 20L, 1L, 2L, 5L, 6L, 7L, 9L, 10L, 11L, 12L, 16L, 18L,  1L, 2L, 7L, 10L, 12L, 15L, 17L), levels = c("Bythotrephes", "Chironomid Pupae",  "Copepod", "Cyclopoid", "Daphnia", "Amphipod", "Chironomid Larvae",  "Chydorid", "Dreissena", "Goby", "Hemimysis", "Isopod", "Sphaeriidae",  "Trichopteran", "Eurycercidae", "Chironomid Adult", "Chironomid",  "Egg Mass", "Fish Eggs", "Unidentified Prey Fish"), class = "factor"),
    prey_tot = c(17.227374302, 18.112509605, 0.04050358, 0.005066528,
    5.523993801, 2.136988844, 3.658250957, 0.002595249, 3.058675062,
    1.450201253, 0.390600742, 0.012119854, 0.000132338, 3.25891984,
    2.364342323, 0.144497136, 0.843162564, 0.770066004, 10.507750454,
    2.35437128, 1, 3.701960013, 4.425697495, 2.716899247, 1.85298377,
    0.005729159, 0.125721411, 0.089801008, 0.219086164, 2.568237924,
    0.054330796, 0.597450037, 1.999999999, 2.601784687, 1.031812817,
    0.146383739), month_tot = c(58.999999982, 58.999999982, 58.999999982,
    58.999999982, 58.999999982, 58.999999982, 58.999999982, 58.999999982,
    58.999999982, 58.999999982, 58.999999982, 58.999999982, 58.999999982,
    58.999999982, 58.999999982, 58.999999982, 58.999999982, 58.999999982,
    27.000000001, 27.000000001, 27.000000001, 27.000000001, 27.000000001,
    27.000000001, 27.000000001, 27.000000001, 27.000000001, 27.000000001,
    27.000000001, 8.999999999, 8.999999999, 8.999999999, 8.999999999,
    8.999999999, 8.999999999, 8.999999999), prey_frq = c(29.1989395038234,
    30.6991688313997, 0.0686501356141645, 0.00858733559584021,
    9.36270136048353, 3.62201499093553, 6.20042535273911, 0.00439872711998605,
    5.1841950219206, 2.45796822617362, 0.66203515613418, 0.0205421254299959,
    0.000224301694983685, 5.52359295083771, 4.00735987071411,
    0.244910400074718, 1.42908909196142, 1.30519661734735, 38.9175942726327,
    8.71989362930667, 3.70370370356653, 13.7109630106033, 16.3914722030966,
    10.062589803331, 6.86290285159767, 0.0212191074066215, 0.46563485553831,
    0.332596325913608, 0.811430237006984, 28.535976936504, 0.603675511178186,
    6.63833374518204, 22.2222222135802, 28.9087187476565, 11.4645868568294,
    1.62648598906961), pos_label = c(85.4005302480883, 55.4514760804767,
    40.0675665969698, 40.0289478613648, 35.3433035133251, 28.8509453376155,
    23.9397251657782, 20.8373131258487, 18.2430162513284, 14.4219346272813,
    12.8619329361274, 12.5206442953453, 12.5102610817828, 9.74835245551644,
    4.98287604474054, 2.85674090934613, 2.01974116332806, 0.652598308673674,
    80.5412028636837, 56.722458912714, 50.5106602462774, 41.8033268891925,
    26.7521092823425, 13.5250782791287, 5.06233195166436, 1.6202709721622,
    1.37684399068974, 0.977728399963794, 0.405715118503494, 85.732011531748,
    71.1621853079069, 67.5411806797268, 53.1109027003457, 27.5454322197273,
    7.3587794174843, 0.813242994534804), Type = structure(c(1L,
    1L, 1L, 1L, 1L, 2L, 2L, 2L, 2L, 2L, 2L, 2L, 2L, 3L, 3L, 3L,
    3L, 3L, 1L, 1L, 1L, 2L, 2L, 2L, 2L, 2L, 2L, 3L, 3L, 1L, 1L,
    2L, 2L, 2L, 2L, 3L), levels = c("Pelagic", "Benthic", "Other"
    ), class = "factor")), row.names = c(NA, -36L), groups = structure(list(
    Season = structure(1:3, levels = c("Pre-Hypoxic", "Peak-Hypoxic",
    "Post-Hypoxic"), class = "factor"), .rows = structure(list(
        1:18, 19:29, 30:36), ptype = integer(0), class = c("vctrs_list_of",
    "vctrs_vctr", "list"))), class = c("tbl_df", "tbl", "data.frame" ), row.names = c(NA, -3L), .drop = TRUE), class = c("grouped_df",  "tbl_df", "tbl", "data.frame"))
Also ran this line:
list <- c('Other' = 'none', 'Pelagic' = 'stripe', 'Benthic' = 'circle')
I have the following packages loaded:
library(ggplot2)
library(tidyverse)
library(scales)
library("RColorBrewer")
library(data.table)
library(ggsci)
library(ggpattern)
I factored and ordered the "Type" group because I want the legend in the following order: Pelagic, Benthic, Other.
Specifically, I would like to:
- Have the pattern more clear in the legend. For example, have more lines (more than 1) for the "pelagic" group and more circles for the "benthic" group in the legend.
- Add an outline(box) outside the legend pattern items (have a box/outline for the lines, one for the circles, and one for the blank ("other") group.
- Remove the title "Type" for this legend while keeping the title "Prey Name" for the other legend.
- Not extremely important, but is it possible to move the pattern legend while keeping the Prey Name legend where it is (moving the pattern to the "top" position for example). Or can I center/align the pattern ("Type") legend so it is centered (in the middle) over the Prey Name legend?
I have been trying to edit the legend for a few days now, but nothing I have tried has worked/improved it.
Any other suggestions on the aesthetics of this plot are welcome!
Thank you!


