I have a problem while implementing the marker controlled watershed in Matlab.
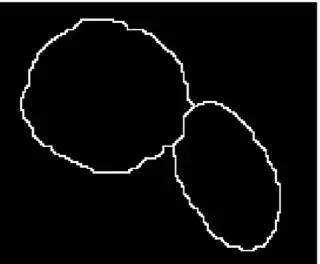
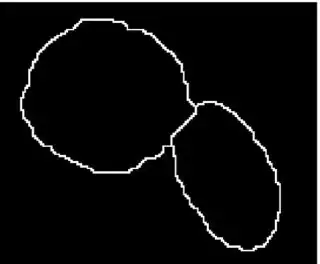
The input image is a binary mask which have two clustered object. An other image is an other binary image where the white regions indicate the markers.

Then I try to use the marker controlled watershed to splitting the clustered object. The code is as follows:
bw=imread('Im.jpg'); % read image
bwMarker=imread('Marker.jpg');% read marker
bw(bwMarker)=0; % impose the marker on the image
L=watershed(bw);% do the watershed
%% plot
rgb = label2rgb(L,'jet',[.5 .5 .5]);
figure(2), imshow(rgb,'InitialMagnification','fit')
title('Marker Controlled Watershed transform ')
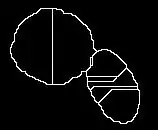
The result is show as this plot.

It splits the object into two, but the shape is not intact. I want to get the whole object but just a line splitting the two (as shown below) Can anybody help me out? Thanks.

Appended question: Thank you for yoda provides the answer. However, in this case, the distance transform using 'cityblock' is good but if we using 'euclidean' it will lead to over segmentation. Because the watershed will depend on the local minimums in the image and it is coincident that the 'cityblock ' distance transform result in correct number of local minimums. If we apply the 'cityblock' for other image, it will lead to over segmentation as well. Now let's see yoda's code:
img=im2bw(imread('https://i.stack.imgur.com/qrYCL.jpg'));

imgDist=-bwdist(~img,'cityblock');
imgDist(~img)=-inf;

% check local minimums
BW = imregionalmin(imgDist);
figure(1), imshow(BW);
title('Regional Minima in Original Image');

imgLabel=watershed(imgDist);
The local minimums and the result are shown as follows:

Note that in the left figure, the local minimum are show as white regions. It is observed that only two local minimum shown in the clustered objects. So leads to the good results.
Now let's take a look at the distance transform by using 'euclidean'.
imgDist=-bwdist(~img);
imgDist(~img)=-inf;

% check local minimums
BW = imregionalmin(imgDist);
figure(1), imshow(BW);
title('Regional Minima in Original Image');

imgLabel=watershed(imgDist);

imshow(imgLabel==0,'InitialMagnification','fit')
The local minimums and the result are shown as follows:

Note that in the left figure, the local minimum are show as white regions. It is observed that there are many local minimum shown in the clustered objects region. So this leads to the over-segmented results.
The over segmentation is because the watershed will first check out the local minimums in the image, then base on the local minimums, perform the watershed. Note that if there are too many local minimums than the desired segmented objects, it will lead to over segmentation. The marker controlled watershed is proposed to replace the original local minimums and achieve better result(since each marker will represent one desired segmented object). But I don't know how to impose the 'marker' so that the original local minimums are depressed and the image only have the local minimums specified by the 'marker'. Thanks.