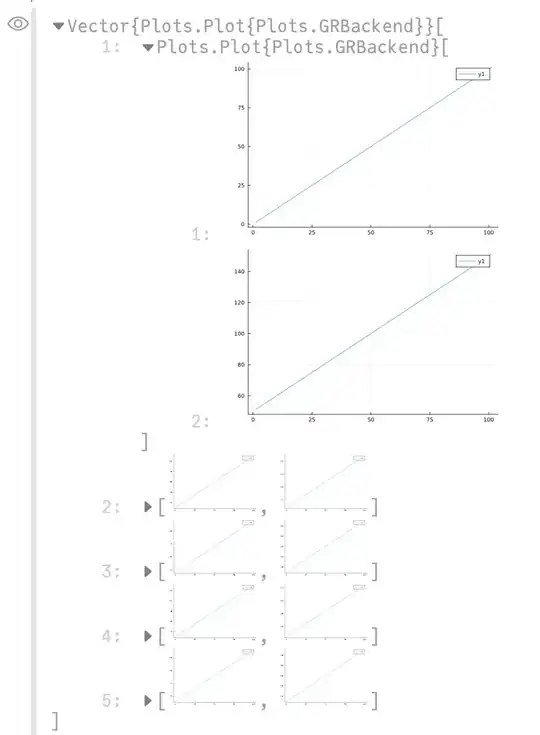
This is the code I'm trying to run
begin
    for i in 1:10:100
        display(Plots.plot(x[i:i+100]))
    end
end
and this is the output I get
Plot{Plots.GRBackend() n=1}Plot{Plots.GRBackend() n=1}Plot{Plots.GRBackend() n=1}Plot{Plots.GRBackend() n=1}Plot{Plots.GRBackend() n=1}Plot{Plots.GRBackend() n=1}Plot{Plots.GRBackend() n=1}Plot{Plots.GRBackend() n=1}Plot{Plots.GRBackend() n=1}Plot{Plots.GRBackend() n=1}
I'm trying to get a series of different figures that show the different slices of x that are specified in each loop. Does anyone know how I can achieve this?
