4

Is there a way to add text labels to the points on a scatterplot? Each point has a string associated with it as its label. I like to label only as many points as it can be done withour overlapping?

df = DataFrame(x=rand(100), y=rand(100), z=randstring.(fill(5,100)))
scatter(df.x, df.y)
annotate!(df.x, df.y, text.(df.z))
siebenstein
  • 119
  • 5

3 Answers3

2

using StatisticalGraphics package:

using InMemoryDatasets
using StatisticalGraphics
using Random

ds=Dataset(x=rand(100), y=rand(100), z=randstring.(fill(5,100)))
sgplot(ds, Scatter(x=:x,y=:y,labelresponse=:z))

enter image description here

giantmoa
  • 327
  • 5
  • 1
    if there is another column `insertcols!(ds,:g=>rand(["g1","g2"],100))`, then it is possible to code like `sgplot(ds, Scatter(x=:x,y=:y,group=:g,labelresponse=:z,labelcolor=:group))`, fascinating! – giantmoa Nov 08 '22 at 23:35
1

Here is something I wrote for Makie.jl that suited my needs:

Non-overlapping labels for scatter plots

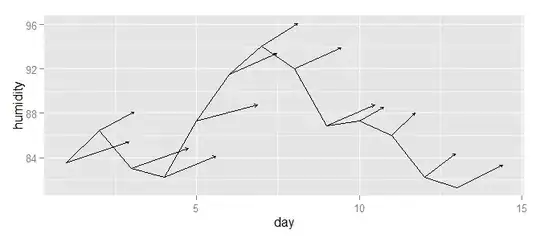
It works best for single line, short text labels, and where all labels have similar lengths with one another. It is still WIP, as I am working to improve it for placement of longer text labels.

Here are some samples of what it can do:

Near linear distribution of data Random distribution of data Quadratic distribution of data

Essentially, you call function viz to plot a scatter chart on your (x, y) data set:

resolution = (600, 600)     # figure size (pixels) -- need not be a equal dimension
fontpt = 12                 # label font size (points)
flabel = 1.5                # inflate the label size to create some margins
fdist = 0.3                 # inflate the max. distance between a label and its
                            #   anchor point before a line is drawn to connect. them.
                            #   Smaller values would create more connecting lines.

viz(x, y, labels; resolution=resolution, flabel=flabel, fdist=fdist, fontpt=fontpt)

where labels is a list containing the text labels for every pair of (x, y) point.

cbsteh
  • 809
  • 6
  • 19
0

You can use the extra named argument series_annotations in the scatter function. Here us an example where I use "1", "2", etc. as labels:

using Plots

x = collect(0:0.1:2)
y = sinpi.(x)

scatter(x, y, series_annotations = text.(1:length(x), :top))

enter image description here

Avoiding overlaps is more difficult. You could customize your label with empty "" for duplicates where the points are the same, or see for Makie: Makie: Non-overlapping label placement algorithm for scatter plots

Bill
  • 5,600
  • 15
  • 27