-1

I'm trying to get something like this:

enter image description here

with this code

x = np.arange(l, r, s)
y = np.arange(b, t, s)
X, Y = np.meshgrid(x, y)
Z = f(X,Y)

plt.axis('equal')
plt.pcolormesh(X, Y, Z)
plt.savefig("image.png",dpi=300)

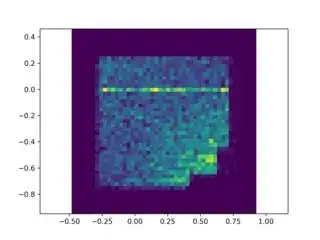
But I get this:

enter image description here

How could I remove the white regions? I really appreciate any kind of help.

Davide Modesto
  • 225
  • 3
  • 9
  • Remove `plt.axis('equal')` – DavidG Nov 18 '22 at 12:17
  • I want the axis to be equal – Davide Modesto Nov 18 '22 at 12:36
  • 1
    [`plt.axis('equal')`](https://matplotlib.org/stable/api/_as_gen/matplotlib.pyplot.axis.html) is a shortcut for `ax.set_aspect('equal', adjustable='datalim')`. You might want to change it to `plt.axis('scaled')` which adjusts the box instead of the datalim. – JohanC Nov 18 '22 at 13:05

2 Answers2

1

i would use the pyplot subplots to define the figures size and therefor aspect like this

import numpy as np
from matplotlib import pyplot as plt

def f(x,y):
    return x + y

x = np.arange(1, 10, .1)
y = np.arange(1, 10, .1)
X, Y = np.meshgrid(x, y)
Z = f(X,Y)


f, ax = plt.subplots(figsize=(4, 4))
plt.pcolormesh(X, Y, Z)
plt.show()

output

enter image description here

as pointed out by @JohanC, this also works and might be a better solution in some cases. it does not require the 'subplots' function which returns a figure and a subplot.

plt.pcolormesh(X, Y, Z)
plt.axis('scaled')
plt.show()

output

enter image description here

AlexWach
  • 592
  • 4
  • 16
-1

Anwered here You can remove the margins at the edges of the plot.

plt.margins(x=0)
Double_LA
  • 1
  • 1