2

Recently i am want trying to change some pie chart legend to showing the percentage legend but seem is really confusing for me

I am already try some change with series.dataMarker.labelContent = SFChartLabelContentPercentage; but seem doesnt go well, Maybe anyone try to help me?

Here the source code

series: <CircularSeries>[
                  PieSeries<CatChartData, String>(
                      animationDuration: 700,
                      dataSource: controller.displyDataList,
                      explode: true,
                      explodeGesture: ActivationMode.singleTap,
                      xValueMapper: (CatChartData data, _) => data.category,
                      yValueMapper: (CatChartData data, _) => data.toatal,
                      dataLabelMapper: (CatChartData data, _) => data.category,
                      sortingOrder: SortingOrder.descending,
                      legendIconType: LegendIconType.circle,
                      dataLabelSettings: const DataLabelSettings(
                        isVisible: true,
                        connectorLineSettings:
                            ConnectorLineSettings(type: ConnectorType.curve),
                        overflowMode: OverflowMode.shift,
                        showZeroValue: false,
                        labelPosition: ChartDataLabelPosition.outside,
                      ))
                ],
Blaismer
  • 27
  • 4
  • 1
    Be aware that the SyncFusion products in the Dart/Flutter pub are *not* open source. They are released under a commercial license that may subject you or your organization to a financial liability, and might affect downstream re-users of your code. – Randal Schwartz Dec 09 '22 at 21:58

2 Answers2

2

The requirement can be achieved in the following ways:

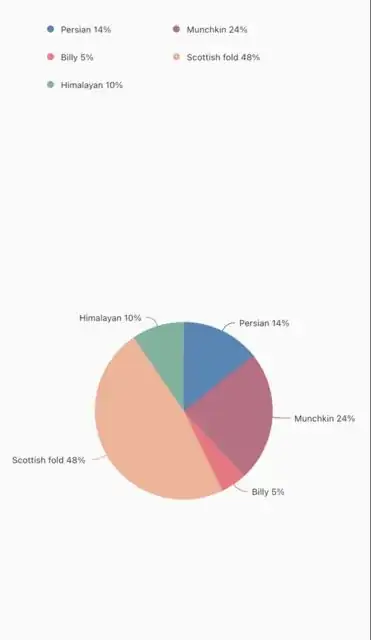
  1. In the legend, you can show the percentage value of the pie series segment to its respective legend item with the help of the legendItemBuilder. Using this, you can customize the appearance of legend items.

  2. In the data label, you can show the percentage value of the segment with the help of the builder properties and customize its appearance as you want.

We have shared the code snippet below for your reference, you can modify that as per your requirement.

Screenshot:

enter image description here

Code snippet:

import 'package:flutter/material.dart';
import 'package:syncfusion_flutter_charts/charts.dart';


void main() {
  runApp(const MyApp());
}


class MyApp extends StatelessWidget {
  const MyApp({super.key});


  @override
  Widget build(BuildContext context) {
    return MaterialApp(
      title: 'Flutter Demo',
      theme: ThemeData(
        primarySwatch: Colors.blue,
      ),
      home: const MyHomePage(),
    );
  }
}


class MyHomePage extends StatefulWidget {
  const MyHomePage({super.key});


  @override
  State<MyHomePage> createState() => _MyHomePageState();
}


class _MyHomePageState extends State<MyHomePage> {
  late List<CatChartData> chartData;
  num totalValue = 0;
  @override
  void initState() {
    chartData = [
      CatChartData('Persian', 15000),
      CatChartData('Munchkin', 25000),
      CatChartData('Billy', 5000),
      CatChartData('Scottish fold', 50000),
      CatChartData('Himalayan', 10000),
    ];
    for (var element in chartData) {
      totalValue += element.total;
    }
    super.initState();
  }


  @override
  Widget build(BuildContext context) {
    return Scaffold(
      appBar: AppBar(),
      body: SfCircularChart(
          legend: Legend(
            overflowMode: LegendItemOverflowMode.wrap,
            isVisible: true,
            legendItemBuilder: (String legendText, dynamic series,
                dynamic point, int seriesIndex) {
              return Padding(
                padding: const EdgeInsets.all(10.0),
                child: SizedBox(
                  width: 125,
                  child: Row(
                    children: [
                      Container(
                        height: 8,
                        width: 8,
                        decoration: BoxDecoration(
                          borderRadius: BorderRadius.circular(4),
                          color: series.renderPoints[point.index].color,
                        ),
                        margin: const EdgeInsets.only(right: 8.0),
                      ),
                      Text(
                        '$legendText ${(point.y / (totalValue / 100)).round()}%',
                        style: const TextStyle(fontSize: 10),
                      ),
                    ],
                  ),
                ),
              );
            },
          ),
          series: [
            PieSeries<CatChartData, String>(
                animationDuration: 700,
                dataSource: chartData,
                radius: '50%',
                explode: true,
                explodeGesture: ActivationMode.singleTap,
                xValueMapper: (CatChartData data, _) => data.category,
                yValueMapper: (CatChartData data, _) => data.total,
                dataLabelMapper: (CatChartData data, _) => data.category,
                sortingOrder: SortingOrder.descending,
                legendIconType: LegendIconType.circle,
                dataLabelSettings: DataLabelSettings(
                  isVisible: true,
                  builder: (dynamic data, dynamic point, dynamic series,
                      int pointIndex, int seriesIndex) {
                    return Text(
                      data.category +
                          ' ${(data.total / (totalValue / 100)).round()}' +
                          '%',
                      style: const TextStyle(fontSize: 10),
                    );
                  },
                  connectorLineSettings:
                      const ConnectorLineSettings(type: ConnectorType.curve),
                  overflowMode: OverflowMode.shift,
                  showZeroValue: false,
                  labelPosition: ChartDataLabelPosition.outside,
                ))
          ]),
    );
  }
}


class CatChartData {
  final String category;
  final num total;


  CatChartData(this.category, this. Total);
}
yuva
  • 436
  • 4
  • 9
0

You can achieve this task by referring below code sample.

SfCircularChart(
              title: ChartTitle(text: "Break-up of Total Payment"),
              legend: Legend(
                  isVisible: true,
                  overflowMode: LegendItemOverflowMode.wrap,
                  position: LegendPosition.bottom),
              series: <CircularSeries>[
                // Render pie chart
                PieSeries<ChartData, String>(
                  dataSource: chartDataList,
                  pointColorMapper: (ChartData data, _) => data.color,
                  xValueMapper: (ChartData data, _) => data.x,
                  yValueMapper: (ChartData data, _) => data.y,
                  dataLabelMapper: (ChartData data, _) => "${data.y}%",
                  dataLabelSettings: DataLabelSettings(
                    isVisible: true,
                  ),
                )
              ]),

by using dataLabelMapper: (ChartData data, _) => "${data.y}%", this code line you can show % mark on data labels.

enter image description here

Lakmal Ja
  • 91
  • 4