0

I am working on a function in C programming and would like to create a function based off of the given data points but I cannot seem to get something that fits this curve. See graph here:

graph

My program will primarily use this function in the 0-500°F range so it is important that this range is accurate.

Using this graph I have determined the data points to be approximately:

Temp(F), Factor

(-300, 1.57)
(-200, 1.33)
(-100, 1.16)
(0, 1.05)
(100, 0.98)
(200, 0.94)
(300, 0.915)
(400, 0.865)

I have found that y = 0.00000244x^2 -0.001x + 1.05 is a close fit for the -300-100°F range but gets very bad for x>100°F values.

y = 1.6904761904745*10^-6 x^2 - 0.00109048x + 1.0628 seems to be closer.

I figure that I need a cubic function to model this well, but I can't figure out what it would be. Any recommendations? I was also thinking that I could model T<200°F & T>200°F as separate functions.

EDIT1 I have found a set of linear piecewise functions that fit the dataset, still probably inaccurate for the 400-500°F range.

1.) y=-0.0024x + 0.85 {-300< x <-200}
2.) y=-0.0017x + 0.99 {-200< x <-100}
3.) y=-0.0011x + 1.05 {-100< x < 0}
4.) y=-0.0007x + 1.05 {0 < x <100}
5.) y=-0.0004x + 1.02 {100 < x < 200}
6.) y=-0.00025x + 0.99 {200 < x < 300}
7.) y=-0.0005x + 1.065 {300< x < 400}
8.) y=-0.00065x + 1.125 {400< x < 500} *estimated factor to be 0.8 @ 500°F*

piecewise functions

EDIT2

I was able to model this pretty well with the help of JJacquelin's answer below. I have settled on using a piecewise set of two functions:

1.) y = 0.83583 + 0.218653e^{-0.00404x} {-400 < x < 185} 
2.) y = -0.0000014x^2 + 0.000465x + 0.9027 {185 < x < 500}

Interactive graph here two piecewise functions

EDIT 3:

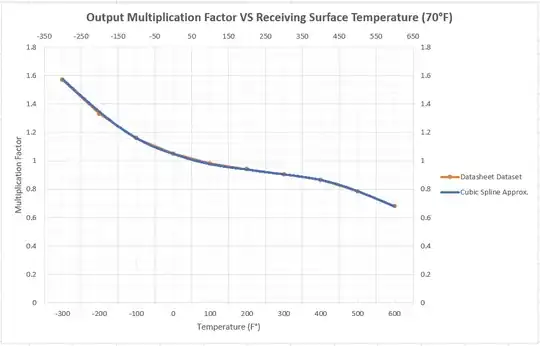
JAlex Has a good point about using Cubic Spline interpolation. This is the method I ended up using. I found an Arduino library and adapted it to my project. sakov/csa-c (Cubic Spline Approximation

You can see the the cubic spline approximation (CSA) fits the original dataset quite well. Keep in mind the point for T=500°F & T=600°F were estimated using equation 2 from EDIT2. Given Dataset compared to CSA
Accentrix
  • 23
  • 6
  • Why both C and Python tags? – zvone Dec 14 '22 at 22:29
  • I'm not a mathematician, but... If the sub-zero temps are of little or no interest to your application, it's probably not worth trying to fit your function to those data points. Try fitting to only the graph that represents your application. – Fe2O3 Dec 14 '22 at 22:35
  • Instead of trying to fit one cubic function over the entire range, try a cubic spline function, which has different parameters for different intervals, setting the parameters so that the transition from one interval to the next is smooth. A web search for "cubic spline python" should find some resources. – Robert Dodier Dec 15 '22 at 01:48
  • I would go for cubics... why not use [Piecewise interpolation cubic example](https://stackoverflow.com/a/22806242/2521214) ... if you want single cubic curve then just fit it for example with this [How approximation search works](https://stackoverflow.com/a/36163847/2521214) so one coefficient is equal to first point and the next 3 can be fitted with `~O(log^3(n))` complexity for quadratics its one coefficient and power less – Spektre Dec 15 '22 at 07:41
  • Would a cubic spline interpolation work here? – JAlex Dec 15 '22 at 20:51

1 Answers1

2

Another convenient model (exponential function) :

enter image description here

Method of fitting from https://fr.scribd.com/doc/14674814/Regressions-et-equations-integrales

JJacquelin
  • 1,529
  • 1
  • 9
  • 11
  • A great example of how effective assuming the right function to start can make all the difference. – duffymo Dec 15 '22 at 15:09
  • Thank you! This function looks goof for the -400 to 100 range, but not so much for the >100 range. – Accentrix Dec 15 '22 at 18:47
  • I seem to have made a pretty accurate curve using the function you have provided in a piecewise manner. I am using the following: y = 0.83583 + 0.218653e^{-0.00404x} {-400 < x < 185} y = -0.0000014x^2 + 0.000465x + 0.9027 {185 < x < 500} – Accentrix Dec 15 '22 at 19:30