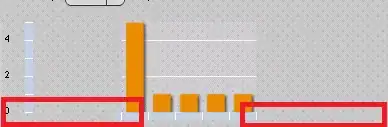
I am using Flex 3 Column chart component. In this, I have a custom container which in minimized(25% of maximized screen) mode, it is not showing horizontal axis properly(in short not utilizing the whole container area properly) and hence H axis is cut on left and right. If I maximize container, it shows perfect graph.
Attached the image.