My first ever post, and I’m a relatively new coder.
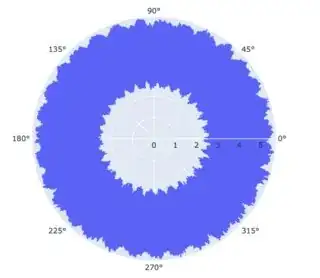
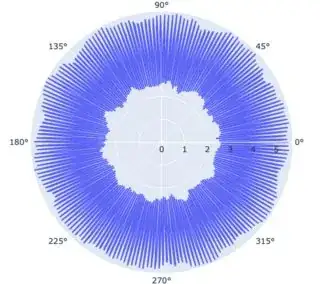
I’m interested in data visualisation, and I’m trying to create a poster that can depict a Soundwave in a circular format.
I’ve tried to attach a photoshop mock-up of what I’m aiming for, but I’m new and so I don’t have enough status points for images (will try and host elsewhere and link back to a URL)
Is there a way to take a plot and wrap into a circular format directly from a plotting library? I’ve searched high and low for the right code, but can’t seem to pin down something that works for sound wave plots.
I could export a normal wave plot and “wrap to polar” in photoshop, or some other Python code that wraps “images” or plots using a different library, but I’m wondering if I’m missing something obvious with built-in plotting options.
I’ve searched the matplotlib documentation (perhaps not very well, I am new to coding) and can only find references to circular bar plots and radar charts. Not found a way that stands out (to me) how to take any similar arguments and apply to a Soundwave.
Bonus points if the same could be done for spectrographs! Thank you!
Many thanks in advance, all guidance gratefully received.


