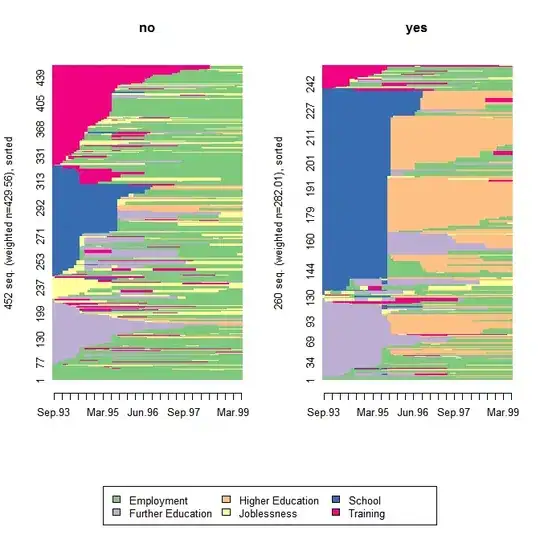
my code is so simple
this is my code
import cufflinks as cf
import pandas as pd
cf.go_offline()
cf.set_config_file(offline=False, world_readable=True)

@st.cache
def get_data(url):
    df = pd.read_csv(url)
    df["date"] = pd.to_datetime(df.date).dt.date
    df['date'] = pd.DatetimeIndex(df.date)

    return df

url = "https://covid.ourworldindata.org/data/owid-covid-data.csv"
data = get_data(url)

daily_cases = data.groupby(pd.Grouper(key="date", freq="1D")).aggregate(new_cases=("new_cases", "sum")).reset_index()
fig = daily_cases.iplot(kind="line", asFigure=True,
                        x="date", y="new_cases")
st.plotly_chart(fig)
the result of my code is something like :
now i want to change the height and width of the plot and also change the background od it to white and i want change the color of line to two color half of it to blue and othe half to red
thanks in advance for your help and advaice

