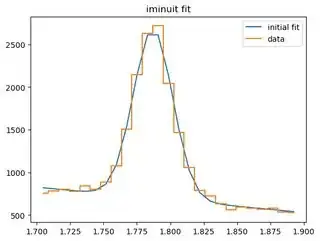
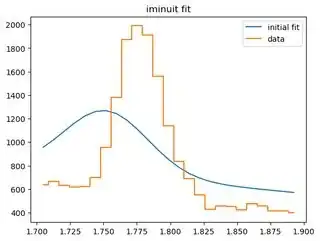
I am trying to fit a gaussian peak + linear background shape to a histogram. The histogram shape is pretty distinct and the fitting with minuit still fails sometimes. I cannot figure out why since it works most of the time with similar histograms with the same initial parameter guess. Here is my function that does the fit:
def iminuit_fit(
    counts, mu, sigma, slope, b, datax, datay, pdf, model_function, yerr_systematic=0.0
):
    c = cost.UnbinnedNLL(datay, pdf)
    m = Minuit(
        c,
        counts=counts * 0.9,
        mu=mu * 0.9,
        sigma=sigma * 0.9,
        slope=slope * 0.9,
        b=b * 0.9,
    )
    m.errordef = Minuit.LIKELIHOOD
    m.limits["mu"] = (1,2)
    m.limits["counts"] = (0, None)
    m.limits["sigma"] = (0,1)
    m.limits["slope"] = (None, 0)
    m.limits["b"] = (0, None)
    m.print_level = 0
    m.migrad()
    result_p = m.values
    errors_p = m.errors

    fig0, ax0 = plt.subplots()
    ax0.plot(datax, model_function(datax, *result_p), label="initial fit")
    ax0.plot(datax, datay, drawstyle="steps-mid", label="data")
    ax0.set_title("iminuit fit")
    ax0.legend()

    return result_p.to_dict(), errors_p.to_dict()
and I set the parameter guesses as below and do the fitting. The parameters are such that total(x) = counts * normal(mu,sigma) + slope * x + b:
p, err = iminuit_fit(counts=50, mu=1.8, sigma=0.1, slope=-1200, b=3000, datax=axis_interest, datay=hist_interest, pdf=poisson_pmf, model_function=total)
I tried with nine similar histograms with exactly the same code and two of the fitting failed as below. The first picture is what most of the nine looks like. If anyone has an idea of how I can improve this, please let me know!


