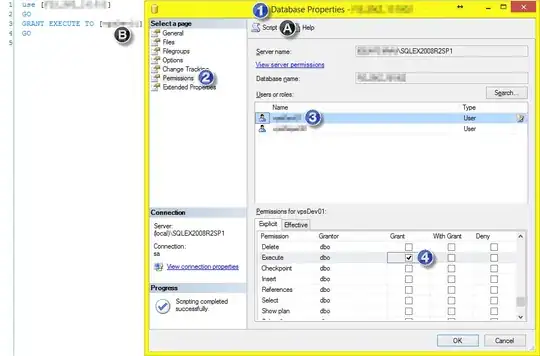
I have computed a covariance of 26 inputs from another software. I have an existing table of the results. See image below:

What I want to do is enter the table as a pandas dataframe and plot the matrix. I have seen the thread here: Plot correlation matrix using pandas. However, the aforementioned example, computed the covariance first and plotted the 'covariance' object. In my case, I want to plot the dataframe object to look like the covariance matrix in the example.
Link to data: HERE.


