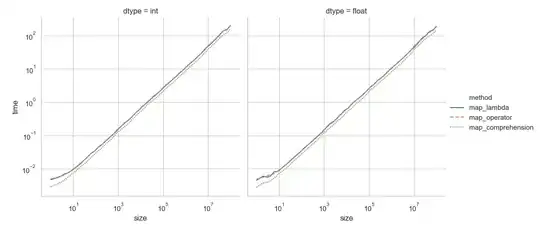
How can I change the position of my legend in this arranged plot, so I get to visualize all the legend?
I have the following code:
plotCNAE_decils <- ggarrange(plotalimentacio_2021_decils, plottabac_2021_decils, plotvestit_2021_decils, plothabitatge_2021_decils, plotmobles_2021_decils, plotsalut_2021_decils,
                      plottransport_2021_decils, plotcomunicacions_2021_decils, plotoci_2021_decils, ploteducacio_2021_decils, plotrestaurants_2021_decils, plotaltres_2021_decils,
                       ncol=4, nrow=3, common.legend=TRUE, legend="bottom")
plotCNAE_decils

annotate_figure(plotCNAE_decils,
                top=text_grob("Despesa monetària en els diferents grups CNAE, per decils de renda. Espanya (2021) \nEn euros i percentatge", size=15, face="bold", hjust=0, x=0.01, vjust=0.4),
                bottom=text_grob("Font: Elaboració pròpia a partir de dades de l'Enquesta de pressupostos familiars del 2021, base 2016, de l'INE.", hjust=0, x=1, face="italic", size=10))
