3

I am using ggplot2 to draw a line chart with the following R codes:

library(ggplot2)

X <-c(0, 1, 2, 3, 4,  5)
Y <-c(1, 2, 3, 2, 1, 2)
df <- data.frame(X=X, Y=Y)

ggplot(data=df, mapping=aes(x=X, y=Y))+
  geom_line(colour="violet", size=3, linetype=2)+
  geom_point(shape=23, fill="blue", color="darkred", size=3)

and the output is fine like this:

enter image description here

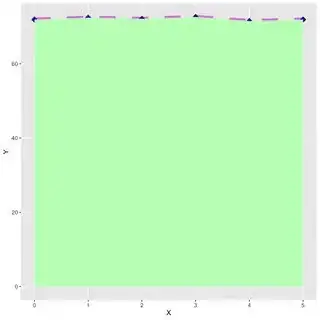
However, I would like to color the under density curve and I change the codes like these:

ggplot(data=df, mapping=aes(x=X, y=Y))+geom_line(colour="violet", size=3, linetype=2)+geom_point(shape=23, fill="blue", color="darkred", size=3)+geom_area("darkseagreen1")

and I got output like this:

enter image description here

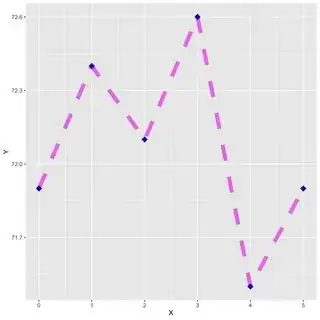
This is not ideal so I try to set the tick marks interval using the following code:

ggplot(data=df, mapping=aes(x=X, y=Y))+geom_line(colour="violet", size=3, linetype=2)+geom_point(shape=23, fill="blue", color="darkred", size=3)+geom_area(fill = "darkseagreen1")+scale_y_continuous(breaks = seq(71.4, 72.9, by=0.3), limits=c(71.4,72.7))

It becomes normal but the color is gone like this:

enter image description here

Can anyone help me with this error? Thank you.
tjebo
  • 21,977
  • 7
  • 58
  • 94
liaoming999
  • 769
  • 8
  • 14
  • also related https://stackoverflow.com/questions/36008435/r-ggplot2-geom-area-loses-its-fill-if-limits-are-defined-to-max-and-min-value and https://stackoverflow.com/questions/71306740/set-upper-and-lower-limits-for-geom-area-in-ggplot2 – tjebo Feb 09 '23 at 11:46
  • Agreed @tjebo - I also went to close the question as a duplicate but couldn't (https://stackoverflow.com/a/3606798/12957340), so I posted an answer instead. Not sure if that's the right thing to do in this situation though. Thoughts? – jared_mamrot Feb 09 '23 at 22:23
  • thank you for your help. i cant close it either. – liaoming999 Feb 10 '23 at 04:58
  • 1
    @jared_mamrot that's not a problem. You deserve that bounty :) We can close this once the bounty is over – tjebo Feb 10 '23 at 15:54

2 Answers2

4

You can use geom_area() if you set your limits using coord_cartesian() (see e.g. https://stackoverflow.com/a/3606798/12957340 for more details).

For example:

library(ggplot2)

X <-c(0, 1, 2, 3, 4,  5)
Y <-c(1, 2, 3, 2, 1, 2)
df <- data.frame(X=X, Y=Y)

# starting plot
ggplot(data=df, mapping=aes(x=X, y=Y)) +
  geom_line(colour="violet", size=3, linetype=2) +
  geom_point(shape=23, fill="blue", color="darkred", size=3)
#> Warning: Using `size` aesthetic for lines was deprecated in ggplot2 3.4.0.
#> ℹ Please use `linewidth` instead.

ggsave("example.pdf")
#> Saving 7 x 5 in image

# with geom_area()
ggplot(data=df, mapping=aes(x=X, y=Y)) +
  geom_line(colour="violet", size=3, linetype=2) +
  geom_point(shape=23, fill="blue", color="darkred", size=3) +
  geom_area(fill = "darkseagreen1")

ggsave("example2.pdf")
#> Saving 7 x 5 in image

# add y-axis limits (the problem)
ggplot(data=df, mapping=aes(x=X, y=Y)) +
  geom_line(colour="violet", size=3, linetype=2) +
  geom_point(shape=23, fill="blue", color="darkred", size=3) +
  geom_area(fill = "darkseagreen1") +
  scale_y_continuous(breaks = seq(0, 3, by=0.3), limits = c(1, 2))

ggsave("example3.pdf")
#> Saving 7 x 5 in image

# add y-axis limits without losing data (a solution)
ggplot(data=df, mapping=aes(x=X, y=Y)) +
  geom_line(colour="violet", size=3, linetype=2) +
  geom_point(shape=23, fill="blue", color="darkred", size=3) +
  geom_area(fill = "darkseagreen1") +
  scale_y_continuous(breaks = seq(0, 3, by=0.3)) +
  coord_cartesian(ylim = c(1,2))

ggsave("example4.pdf")
#> Saving 7 x 5 in image

Created on 2023-02-08 with reprex v2.0.2

jared_mamrot
  • 22,354
  • 4
  • 21
  • 46
  • 1
    see also related/duplicate thread https://stackoverflow.com/questions/10365167/geom-bar-bars-not-displaying-when-specifying-ylim for more insight into the problem – tjebo Feb 09 '23 at 10:20
2

You want to use geom_ribbon() instead of geom_area(). Try this code instead:

ggplot(data = df, mapping = aes(x = X, y = Y)) +
  geom_line(colour = "violet", size = 3, linetype = 2) +
  geom_point(shape = 23, fill = "blue", color = "darkred", size = 3) +
  scale_y_continuous(breaks = seq(71.4, 72.9, by = 0.3), limits = c(71.4, 72.7)) +
  geom_ribbon(aes(ymin = 71.4, ymax = Y), fill = "darkseagreen1")

with geom_ribbon

Harrison Jones
  • 2,256
  • 5
  • 27
  • 34