1

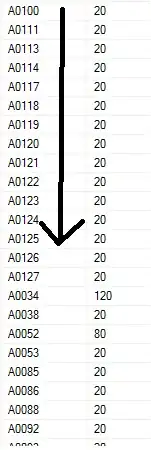
What I'm currently stuck on is trying to plot each column of my dataframe as its own histogram in ggplot. I attached a screenshot below:

Ideally I would be able to compare the values in every 'Esteem' column side-by-side by plotting multiple histograms.

I tried using the melt() function to reshape my dataframe, and then feed into ggplot() but somewhere along the way I'm going wrong...
zephryl
  • 14,633
  • 3
  • 11
  • 30
Luis Loza
  • 11
  • 1
  • 1
    Hi Luis, welcome to Stack Overflow! In the future, please provide your data as copy-pasteable text, [not as an image](https://meta.stackoverflow.com/q/285551/17303805). You can do this using the `dput()` function, using a built-in dataset such as `mtcars` or `ggplot2::mpg`, or by making up data, as I did for my answer below. Look over [this thread](https://stackoverflow.com/q/5963269/17303805) for more on asking effective R questions on Stack Overflow. – zephryl Feb 07 '23 at 16:06

2 Answers2

1

You could pivot to long, then facet by column:

library(tidyr)
library(ggplot2)

esteem81_long <- esteem81 %>% 
  pivot_longer(
    Esteem81_1:Esteem81_10, 
    names_to = "Column", 
    values_to = "Value"
  )

ggplot(esteem81_long, aes(Value)) +
  geom_bar() +
  facet_wrap(vars(Column))

Or for a list of separate plots, just loop over the column names:

plots <- list()
for (col in names(esteem81)[-1]) {
  plots[[col]] <- ggplot(esteem81) +
    geom_bar(aes(.data[[col]]))
}

plots[["Esteem81_4"]]

Example data:

set.seed(13)

esteem81 <- data.frame(Subject = c(2,6,7,8,9))
for (i in 1:10) {
  esteem81[[paste0("Esteem81_", i)]] <- sample(1:4, 5, replace = TRUE)
}
zephryl
  • 14,633
  • 3
  • 11
  • 30
0
esteem_long <- esteem81 %>% pivot_longer(cols = -c(Subject))

plot <- ggplot(esteem_long, aes(x = value)) +
  geom_histogram(binwidth = 1) +
  facet_wrap(vars(name))
plot

I'm using pivot_longer() from tidyr and ggplot2 for the plotting.

The line pivot_longer(cols = -c(Subject)) reads as "apart from the "Subject" column, all the others should be pivoted into long form data." I've left the default new column names ("name" and "value") - if you rename them then be sure to change the downstream code.

geom_histogram automates the binning and tallying of the data into histogram format - change the binwidth parameter to suit your desired outcome.

facet_wrap() allows you to specify a grouping variable (here name) and will replicate the plot for each group.

Paul Stafford Allen
  • 1,840
  • 1
  • 5
  • 16