how I can add geom_text from other dataframe in R
I have two dataframe. And I make geom_bar like this.
ggplot(
  data = sum_slaughter_2021,
  aes(x=month)
) +
  geom_bar(alpha=0.5, aes(y=total_slaughter, fill=kind),position='stack', stat="identity") +
  theme_minimal(base_family = "AppleSDGothicNeo-SemiBold") +
  scale_x_continuous(name = "기간", breaks = seq(1, 12, 1), labels = paste0(seq(1, 12, 1), '월')) +
  theme(
    plot.title = element_text(hjust = 0.5,size=18, color = "royalblue4", face="bold"),
    panel.grid.major = element_blank(),
    panel.grid.minor = element_blank(),
    panel.grid.major.y = element_line(size = 0.1, color = "grey"),
    panel.grid.minor.y = element_line(size = 0.1, color = "grey")
  )

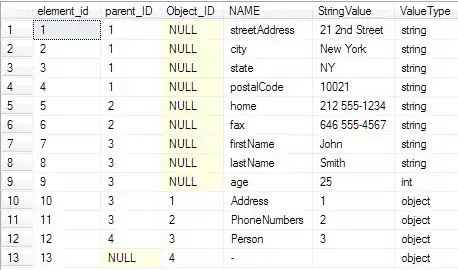
This data frame (sum_slaughter_2021) is like this.

I hope add a geom_text from other dataframe on each geom_bar.
Other dataframe is like this.
I try
ggplot(
  data = sum_slaughter_2021,
  aes(x=month)
) +
  geom_bar(alpha=0.5, aes(y=total_slaughter, fill=kind),position='stack', stat="identity") +
  theme_minimal(base_family = "AppleSDGothicNeo-SemiBold") +
  scale_x_continuous(name = "기간", breaks = seq(1, 12, 1), labels = paste0(seq(1, 12, 1), '월')) +
  geom_text(
    data = month_rate_2021,
    aes(label=paste0(round(month_rate,1),"%"), y=4000)
  ) +
  theme(
    plot.title = element_text(hjust = 0.5,size=18, color = "royalblue4", face="bold"),
    panel.grid.major = element_blank(),
    panel.grid.minor = element_blank(),
    panel.grid.major.y = element_line(size = 0.1, color = "grey"),
    panel.grid.minor.y = element_line(size = 0.1, color = "grey")
  )
But I want geom_text on geom_bar, not in geom_bar.
So I try other way like this.
ggplot(
  data = sum_slaughter_2021,
  aes(x=month)
) +
  geom_bar(alpha=0.5, aes(y=total_slaughter, fill=kind),position='stack', stat="identity") +
  theme_minimal(base_family = "AppleSDGothicNeo-SemiBold") +
  scale_x_continuous(name = "기간", breaks = seq(1, 12, 1), labels = paste0(seq(1, 12, 1), '월')) +
  geom_text(
    data = month_rate_2021,
    aes(label=paste0(round(month_rate,1),"%"), y=sum_slaughter_2021$total_slaughter)
  ) +
  theme(
    plot.title = element_text(hjust = 0.5,size=18, color = "royalblue4", face="bold"),
    panel.grid.major = element_blank(),
    panel.grid.minor = element_blank(),
    panel.grid.major.y = element_line(size = 0.1, color = "grey"),
    panel.grid.minor.y = element_line(size = 0.1, color = "grey")
  )
But I got error like this
Error in `geom_text()`:
! Problem while computing aesthetics.
ℹ Error occurred in the 2nd layer.
Caused by error in `check_aesthetics()`:
! Aesthetics must be either length 1 or the same as the data (12)
✖ Fix the following mappings: `y`