I am looking for a solution to format numbers in R under scientific notation, using the standard format a × 10 b. This is required in several peer-reviewed scientific journals, and modifying graphs by hand may become tedious.
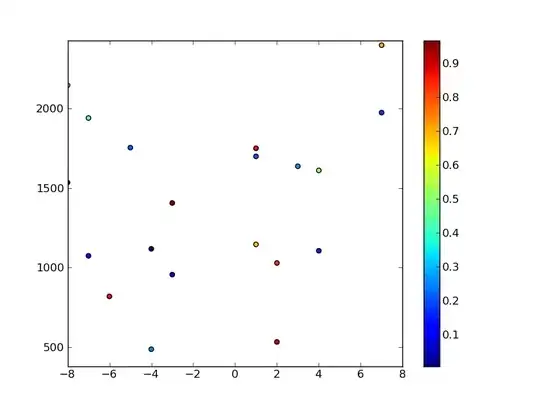
Below, an example of how the R standard "E notation" looks like, and how I would like it to look like:
var<-0.00000000000000000000000000000031267781238
plot(1,main=var)
Thanks for any suggestion you will have!


