0

I am attempting to plot a 3D surface, with the following code:

fig = plt.figure()
ax = fig.add_subplot(projection = '3d')
ax.plot_surface(x, y, z)
ax.set_aspect('equal') # not relevent to the problem
plt.show()

Now, this outputs a figure, as one would expect, but the problem is that the axes are a little unconventional.enter image description here

I would like to output the figure such that the x, y (not necessarily z) axes zeros line up, or essentially, like the following (which can be obtained by just panning the figure manually):enter image description here
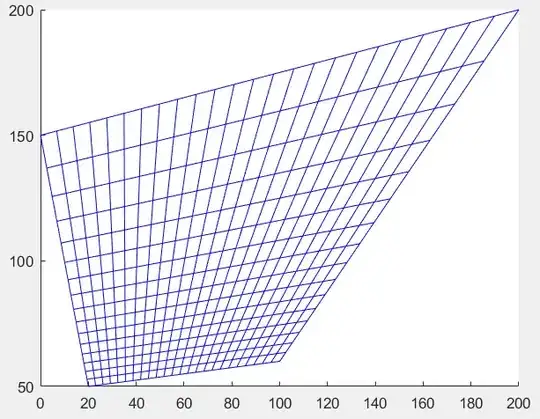
Is there a matplotlib.pyplot command I'm missing?

1 Answers1

1

Solution

Include the line ax.view_init(45,45) before calling plt.show().

Explanation

ax.view_init(...) is a command which sets the initial perspective of a subplot when plt.show() is called. It takes in four parameters elev=None, azim=None, roll=None, vertical_axis='z'. All of them have a default, so for your purpose, you will only need to include the two float values for the elevation and azimuth.

Link to documentation: https://matplotlib.org/stable/api/_as_gen/mpl_toolkits.mplot3d.axes3d.Axes3D.view_init.html

trent
  • 359
  • 1
  • 9
  • This is not quite what I wanted. I wanted `ax.view_init(azim = 225)`. However, because that was the key I was missing, I'm still accepting it as an answer. Thanks! – Jacob Ivanov Feb 27 '23 at 20:07