0

I've been trying to generate a uniform spherical distribution in Python using uniform random sampling. For some reason my presumed spherical distribution looks more like an ovoid than like a sphere. I am using the fact that a sphere is defined: x^2 + y^2 + z^2 = R^2 and assuming R = 1 I get that the condition that the points should satisfy to be inside the sphere is: x^2 + y^2 + z^2 <= 1. For some reason this does not work. I have a perfect circular distribution from a top view (projection in the xy plane), but there is clearly a elliptical geometry in the planes xz and yz.

import numpy as np
import numpy.random as rand
import matplotlib.pyplot as plt

N = 10000

def sample_cube(number_of_trials):
    """
    This function receives an integer and returns a uniform sample of points in a square.
    The return object is a list of lists, which consists of three entries, each is a list
    of the copordinates of a point in the space.
    """

    cube = rand.uniform(low = -1, high = 1, size = (number_of_trials, 3))
    x_cube = cube[:,0]
    y_cube = cube[:,1]
    z_cube = cube[:,2]
    return [x_cube, y_cube, z_cube]

def sample_sphere(cube):
    """
    This function takes a list on the form [x_cube, y_cube, z_cube] and then sample
    an spherical distribution of points.
    """
    in_sphere = np.where(np.sqrt(cube[0]**2 + cube[1]**2 + cube[2]**2) <= 1)
    return in_sphere

"""
Main Code
"""
cube = sample_cube(N)
sphere = sample_sphere(cube)
print(sphere[0])
print(cube)

print(cube[0][sphere[0]])
x_in_sphere = cube[0][sphere[0]]
y_in_sphere = cube[1][sphere[0]]
z_in_sphere = cube[2][sphere[0]]
fig = plt.figure()
ax = plt.axes(projection = "3d")
ax.scatter(x_in_sphere, y_in_sphere, z_in_sphere, s = 1, color = "black")
plt.show()
plt.clf
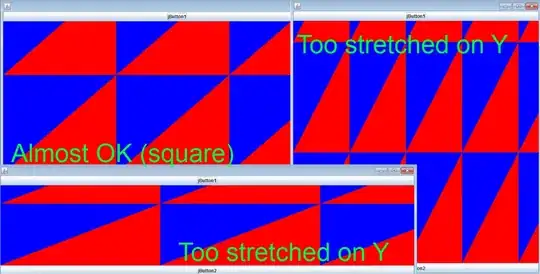
Distribution generated by the code above Side view of the distribution (plane xz) Top view of distribution (plane xy)

I was simply trying to get a uniform sphere. There should be something wrong with the approach, but I can not spot the mistake.

pjs
  • 18,696
  • 4
  • 27
  • 56
  • The "squares in the background grid are not square, they're rectangular even though the ranges are the same for vertical and horizontal axes. It looks like a scaling problem in the plotting, not a problem with generating the data. Your third plot looks like it's properly scaled, the squares are square. – pjs Feb 28 '23 at 19:55
  • Thank you. It was a silly mistake after all hahaha. – Luis Miguel Mar 01 '23 at 10:09

1 Answers1

0

Your min and max values seem to be almost the same for your xyz axes

print(min(x_in_sphere), max(x_in_sphere))
print(min(y_in_sphere), max(y_in_sphere))
print(min(z_in_sphere), max(z_in_sphere))
-0.9799174154721233 0.9854060288509665
-0.9960657675761417 0.9877950419993617
-0.9945133729449587 0.9934754901005494

This means your axes of your plot dont have the same scale. To rescale them you can use the code from this Stackoverflow Question: matplotlib (equal unit length): with 'equal' aspect ratio z-axis is not equal to x- and y-

smth like:

import numpy as np
import numpy.random as rand
import matplotlib.pyplot as plt

N = 10000

def sample_cube(number_of_trials):
    """
    This function receives an integer and returns a uniform sample of points in a square.
    The return object is a list of lists, which consists of three entries, each is a list
    of the copordinates of a point in the space.
    """

    cube = rand.uniform(low = -1, high = 1, size = (number_of_trials, 3))
    x_cube = cube[:,0]
    y_cube = cube[:,1]
    z_cube = cube[:,2]
    return [x_cube, y_cube, z_cube]

def sample_sphere(cube):
    """
    This function takes a list on the form [x_cube, y_cube, z_cube] and then sample
    an spherical distribution of points.
    """
    in_sphere = np.where(np.sqrt(cube[0]**2 + cube[1]**2 + cube[2]**2) <= 1)
    return in_sphere

"""
Main Code
"""
cube = sample_cube(N)
sphere = sample_sphere(cube)
print(sphere[0])
print(cube)

print(cube[0][sphere[0]])
x_in_sphere = cube[0][sphere[0]]
y_in_sphere = cube[1][sphere[0]]
z_in_sphere = cube[2][sphere[0]]
fig = plt.figure()
ax = plt.axes(projection = "3d")
ax.scatter(x_in_sphere, y_in_sphere, z_in_sphere, s = 1, color = "black")
ax.set_aspect('equal')
print(min(x_in_sphere), max(x_in_sphere))
print(min(y_in_sphere), max(y_in_sphere))
print(min(z_in_sphere), max(z_in_sphere))

x_limits = ax.get_xlim3d()
y_limits = ax.get_ylim3d()
z_limits = ax.get_zlim3d()

x_range = abs(x_limits[1] - x_limits[0])
x_middle = np.mean(x_limits)
y_range = abs(y_limits[1] - y_limits[0])
y_middle = np.mean(y_limits)
z_range = abs(z_limits[1] - z_limits[0])
z_middle = np.mean(z_limits)

# The plot bounding box is a sphere in the sense of the infinity
# norm, hence I call half the max range the plot radius.
plot_radius = 0.5 * max([x_range, y_range, z_range])

ax.set_xlim3d([x_middle - plot_radius, x_middle + plot_radius])
ax.set_ylim3d([y_middle - plot_radius, y_middle + plot_radius])
ax.set_zlim3d([z_middle - plot_radius, z_middle + plot_radius])
plt.show()
tetris programming
  • 809
  • 1
  • 2
  • 13