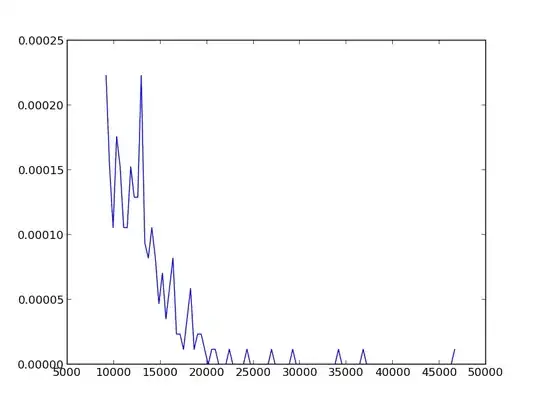
I have a piece of ROS(c++) code that performs an optimization task and I encounter a problem where somewhere in the code there is a bottleneck which pushes a single CPU on which is operating to 100%, creating synchronization and delay issues with communications with other pieces of software. The code uses multiple threads at certain times (mainly for the heavy optimization part). I checked that piece of code using both console commands and the output of htop to tie the process to certain CPUs and I am fairly certain that the issue is not in the multithreading part. I am looking for different ways to track down the bottleneck reliably to either change it altogether or maybe multi-thread it. I have tried using gprof however the results (flat profile and call graph) do not show a strong indication on what the problem could be at least as far as I understand, which is not a lot since I have no experience with profilers and their output in general. I am attaching a small piece of the profiler's call graph output that might give an indication of what is going on to someone more experienced.
[