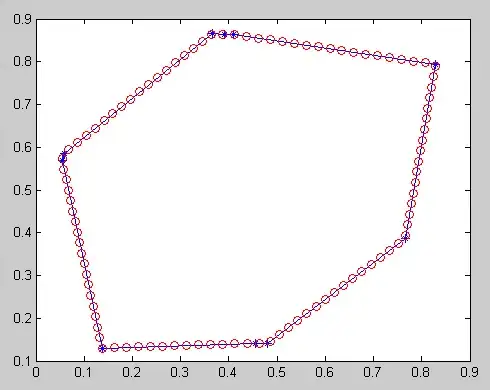
I am using diagrammer for a diagram that should look like the one below but without any success.

I have tried the following code
library(DiagrammeR)
grViz("
digraph boxes_and_circles {

  graph [layout = circo,
      overlap =T,
      outputorder = edgesfirst,
      bgcolor='white',
      splines=line]#controls l type setup
      edge[labelfontname='Arial',fontSize=13,color='red',fontcolor='navy']
      node [shape = box,style='filled',
      fillcolor='indianred4',width=2.5,
      fontSize=20,fontcolor='snow',
      fontname='Arial']
  a;b;c;d;e

  node [shape = square,
        fixedsize = true,
        width = 0.9] // sets as circles
  # several 'edge' statements
  a->b;a->c;a->d;a->e;c->b;d->b;e->b}")
Which gives me the following diagram 
Any thought on how to tweak the code to get the desired output? Any help would be highly appreciated. Thank you.
