0

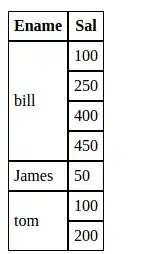
I have data in a dataframe that contains values across multiple years for different IDs. Currently, it appears as follows:

enter image description here

(can be recreated with the following code):

df<-data.frame(WLH_ID=c("15-7318","15-7318","15-7319","15-7319","15-7320","15-7320","15-7320"),
year=c("2017","2018","2017","2018","2017","2018","2019"),
overlap_95=c("1","1","0.626311190934023","0.968386735773874","0.713286882088087","0.824103998854928","0.451493099154607"))

I hope to reshape it to appear as follows::

Essentially I want to pull the value from the row so each year is in its own column- but keep the data in the same row as the ID if that makes sense so I can compare across each ID between years

enter image description here

Some IDs may have more years' worth of data than others, and in such cases, I would like the extra years to be represented as NAs or NULLs.

I am assuming this is something that can be done- just don't know where to start. I couldn't find this question already answered either but I could have worded it wrong.

Thanks in advance!
joran
  • 169,992
  • 32
  • 429
  • 468
  • For reference, what you're trying to do is take your data from a long format (lots of rows) to a wide format (lots of columns). joran's answer down below is spot on. – Stewart Macdonald Mar 12 '23 at 01:49

2 Answers2

1

I think maybe you just need dplyr::pivot_wider()?

> df %>%
   pivot_wider(names_from = year,values_from = overlap_95,names_prefix = "overlap_95_")

# A tibble: 3 × 4
  WLH_ID  overlap_95_2017   overlap_95_2018   overlap_95_2019  
  <chr>   <chr>             <chr>             <chr>            
1 15-7318 1                 1                 NA               
2 15-7319 0.626311190934023 0.968386735773874 NA               
3 15-7320 0.713286882088087 0.824103998854928 0.451493099154607
joran
  • 169,992
  • 32
  • 429
  • 468
0

One way is using pivot_wider(), following rename() your columns, and finally, replace() to replace missing values with blank cells:

library(tidyverse)

dfw <- df %>% pivot_wider(names_from = "year", values_from = "overlap_95") %>%
      rename(verlap_95Y1='2017',verlap_95Y2='2018',verlap_95Y3='2019') %>%
      replace(is.na(.), "")

The dfw should look like this:

View(dfw)

enter image description here

S-SHAAF
  • 1,863
  • 2
  • 5
  • 14