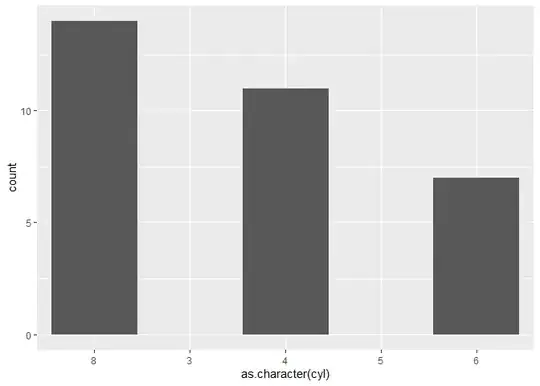
I'm trying to create a plot made up of 6 histograms, using the following code:
import seaborn as sns

df = sns.load_dataset("penguins")
sns.displot(
    df, x="flipper_length_mm", col="species", row="sex",
    stat="percent",
)
This creates a chart where -if I add the height of all the bars in every chart- they sum up to 100. What I want to modify is that I want the same 3x2 chart but in each and every separate subchart the height of the bars should sum up to 100 (ie. I'd see the relative frequencies within every subgroup).
