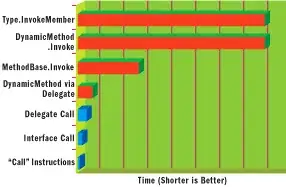
I would like to interpolate and extrapolate the air values along the red line with xarray. I was following the example in the documentation, but I'm missing something, I think my code is interpolating for the entire image? I only want for the red line:

How can I limit the interpolation to only the red line? This is the code:
ds = xr.tutorial.open_dataset("air_temperature")
ds_mean = ds.air.mean(dim='time')

def line(x,A):
    return x, A*x

x, y = line(np.linspace(ds_mean.lon[0], ds_mean.lon[-1], 30), 0.1)
dsi = ds_mean.interp(lon=x, lat=y, kwargs={"fill_value":"extrapolate"})

fig, axes = plt.subplots(ncols=2, figsize=(10, 4))

ds_mean.plot(ax=axes[0],zorder=0, alpha=0.4)
axes[0].plot(x,y,'o',zorder=10)
axes[0].set_title("Mean Air")


dsi.plot(ax=axes[1])

axes[1].set_title("Mean air along one line")