0

The x- and y axis tick labels are overlapping in RStudio. My code is as follows:

ggplot(data1_df, aes(x = Date, y = CO2, group = State, colour = State)) +
    geom_line() +  
    xlab("Year") +
    ylab("CO2 Emissions") +
    ggtitle("CO2 Emissions by State, 1970-2020")

Here is my graph:

enter image description here

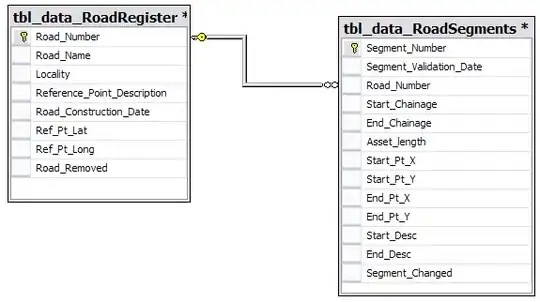
Here are my CO2 values:

enter image description here

Mikael Jagan
  • 9,012
  • 2
  • 17
  • 48
  • 1
    Can you please share your data using `dput()` if possible? It makes it easier for others to run your example if we know what `data1_df` looks like. – nrennie Mar 16 '23 at 00:57
  • Do you get your expected outcome if you use `ggplot(data1_df, aes(x = factor(Date), y = as.numeric(CO2), group = State, colour = State)) +`? – jared_mamrot Mar 16 '23 at 02:16
  • Looks like the issue is that both `Date` and `CO2` are variables of type character (or possibly factor). If you convert the first to type Date and the second to type numeric (or ensure they are of those types when the data is read into R), the chart should look better. – neilfws Mar 16 '23 at 02:36
  • @neilfws Thanks for your support, Dear neilfws. Now I see the logic of it. – Omer Kirac Mar 16 '23 at 12:15
  • @jared_mamrot Thank you for support. You're great. Everything is good now. `ggplot(data1_df, aes(x = Date, y = as.numeric(CO2), group = State, color = State)) + geom_line() + scale_x_continuous(limits = c(1970, 2020), breaks = seq(1970, 2020, by = 5)) + xlab("Yıl") + ylab("CO2 Emisyonları") + ggtitle("Devletlere Göre CO2 Emisyonları, 1970-2020")` – Omer Kirac Mar 16 '23 at 12:20

0 Answers0