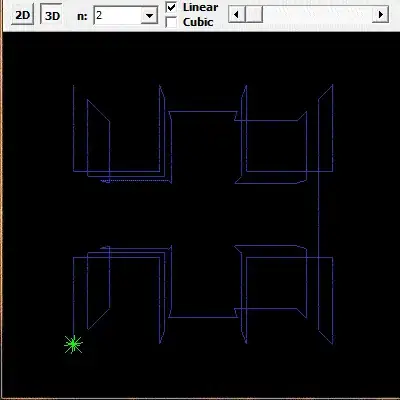
I'm having trouble adding in multiple x axis underneath a bar chart in RStudio using ggplot2. I want it to look something like this:
This is my current code:
ggplot(data=relative_trimming_subset, aes(x=Relative_trimming, y=Stage1_time, fill=Trimming)) +
    geom_bar(stat="identity", position=position_dodge(), show.legend = FALSE) +
    scale_fill_manual(values = c("#cccccc", "#666666", "#cccccc", "#666666")) +
    scale_x_discrete(limits = level_order) +
    theme_bw() +
    labs(x = "Trimming") +
    labs(y = "Stage one time (seconds)") +
    theme(axis.title.x=element_blank(),
          axis.text.x=element_blank(),
          axis.ticks.x=element_blank(),
          panel.grid.major = element_blank(),
          panel.grid.minor = element_blank()) +
    theme(panel.border = element_rect(linewidth = 1)) +
    theme(text = element_text(size = 12),
          axis.title.y = element_text(margin = margin(t = 0, r = 10, b = 0, l = 0)),
          axis.line = element_line(colour = 'black'),
          axis.title = element_text(face="bold"),
          axis.text.y = element_text(size = 10),
          axis.text = element_text(colour = 'black'))
I have tried using the annotate function as laid out here: https://statisticsglobe.com/draw-plot-multi-row-x-axis-labels-r
I have also tried using geom_text, but can't seem to get it to work. If anyone has any advice, that would be great! Feels like it should be simple but I've spent hours on it now...
Thank you.
Reproducible subset of my data:
structure(list(ID = c("TF1-05MB", "TF1-05MB", "TF1-05MB", "TF1-05MB",
"TF1-05MB", "TF1-05MB", "TF1-05MB", "TF1-05MB", "TF1-05MB", "TF1-05MB",
"TF1-05MB", "TF1-05MB", "TF1-05MB", "TF1-05MB", "TF1-05MB", "TF1-07MB",
"TF1-07MB", "TF1-07MB", "TF1-07MB", "TF1-07MB", "TF1-07MB", "TF1-07MB",
"TF1-07MB", "TF1-07MB", "TF1-07MB", "TF1-07MB", "TF1-07MB", "TF1-07MB",
"TF1-07MB", "TF1-07MB"), Sex = c("M", "M", "M", "M", "M", "M",
"M", "M", "M", "M", "M", "M", "M", "M", "M", "M", "M", "M", "M",
"M", "M", "M", "M", "M", "M", "M", "M", "M", "M", "M"), Trimming = c("Untrimmed_full",
"Untrimmed_full", "Untrimmed_full", "Untrimmed_full", "Untrimmed_full",
"Untrimmed_full", "Untrimmed_full", "Untrimmed_full", "Trimmed_full",
"Trimmed_full", "Trimmed_full", "Trimmed_full", "Trimmed_full",
"Trimmed_full", "Trimmed_full", "Untrimmed_control", "Untrimmed_control",
"Untrimmed_control", "Untrimmed_control", "Untrimmed_control",
"Untrimmed_control", "Untrimmed_control", "Untrimmed_control",
"Trimmed_control", "Trimmed_control", "Trimmed_control", "Trimmed_control",
"Trimmed_control", "Trimmed_control", "Trimmed_control"), Relative_trimming = c("Pre",
"Pre", "Pre", "Pre", "Pre", "Pre", "Pre", "Pre", "Post", "Post",
"Post", "Post", "Post", "Post", "Post", "Pre", "Pre", "Pre",
"Pre", "Pre", "Pre", "Pre", "Pre", "Post", "Post", "Post", "Post",
"Post", "Post", "Post"), Day = c(1L, 1L, 1L, 1L, 2L, 2L, 2L,
2L, 3L, 3L, 3L, 3L, 4L, 4L, 4L, 1L, 1L, 1L, 1L, 1L, 2L, 2L, 2L,
3L, 3L, 3L, 3L, 4L, 4L, 4L), Trial_number = c(1L, 2L, 3L, 4L,
1L, 2L, 3L, 4L, 1L, 2L, 3L, 4L, 2L, 3L, 4L, 1L, 2L, 3L, 4L, 5L,
1L, 2L, 3L, 1L, 2L, 4L, 5L, 1L, 2L, 5L), Reaction_time = c(40L,
3L, 37L, 5L, 5L, 5L, 5L, 16L, 8L, 13L, 12L, 7L, 5L, 6L, 6L, 3L,
6L, 6L, 6L, 6L, 17L, 13L, 13L, 9L, 14L, 13L, 12L, 5L, 6L, 5L),
    Stage1_time = c(5L, 5L, 4L, 8L, 5L, 7L, 5L, 8L, 6L, 5L, 7L,
    5L, 5L, 8L, 5L, 7L, 7L, 7L, 6L, 8L, 6L, 7L, 7L, 4L, 5L, 5L,
    16L, 6L, 8L, 6L), PC1_score = c(-0.080373226, 0.032477537,
    -0.155069158, 0.1965224, -0.139819473, -0.013115389, -0.069847159,
    0.045855081, -0.090945817, -0.118591067, 0.028014289, -0.075510197,
    -0.02157794, 0.118944384, -0.065654084, 0.102907134, -0.04347041,
    -0.062195986, 0.028970608, 0.045541099, 0.025417646, 0.074033332,
    0.117344171, -0.083718399, -0.029333778, -0.104413751, -0.133641797,
    -0.020064955, 0.081972399, -0.014783332), S_length = c(3.274,
    3.274, 3.274, 3.274, 3.274, 3.274, 3.274, 3.274, 3.274, 3.274,
    3.274, 3.274, 3.274, 3.274, 3.274, 3.254, 3.254, 3.254, 3.254,
    3.254, 3.254, 3.254, 3.254, 3.254, 3.254, 3.254, 3.254, 3.254,
    3.254, 3.254), D_length = c(2.028, 2.028, 2.028, 2.028, 2.028,
    2.028, 2.028, 2.028, 2.028, 2.028, 2.028, 2.028, 2.028, 2.028,
    2.028, 1.839, 1.839, 1.839, 1.839, 1.839, 1.839, 1.839, 1.839,
    1.839, 1.839, 1.839, 1.839, 1.839, 1.839, 1.839), A_length = c(2.278,
    2.278, 2.278, 2.278, 2.278, 2.278, 2.278, 2.278, 2.278, 2.278,
    2.278, 2.278, 2.278, 2.278, 2.278, 2.077, 2.077, 2.077, 2.077,
    2.077, 2.077, 2.077, 2.077, 2.077, 2.077, 2.077, 2.077, 2.077,
    2.077, 2.077)), class = "data.frame", row.names = c(NA, -30L
))