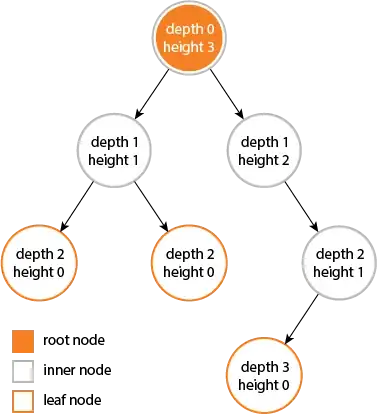
I have some data organized as a binary tree where each node has exactly 0 or 2 children.
I'm looking for an algorithm that allows me to render this tree to an image (PNG preferred).
I want to render the nodes as a box which contains some multiline text representing the data represented by the node.
All nodes should have the same bounding box and the rendering should be aligned like this.
I would appreciate a Python solution but I'm not restricted to it.
I did tried this solution with matplotlib (generated by ChatGPT) but could not adjust the gap between each node so they don't overlap each other.
import matplotlib.pyplot as plt

BOX_WIDTH = 2
BOX_HEIGHT = 2


class Node:
    def __init__(self, val=0, left=None, right=None):
        self.val = val
        self.left = left
        self.right = right

    def get_content(self):
        box_props = dict(boxstyle='square', facecolor='white', edgecolor='black')

        value = self.val
        lines = ['Line 1asdasdasd', 'Line 2', 'Line 3']

        text = '\n'.join(lines)
        content = dict(value=value, text=text, box_props=box_props)

        return content


def plot_tree(node, x, y, parent_x=None, parent_y=None, x_offset=1., y_offset=1.):
    # Get node content
    if node is None:
        return

    content = node.get_content()

    # Draw box containing lines of text
    r = plt.text(x, y, content['text'], bbox=content['box_props'], ha='center', va='center')

    # Plot edge
    if parent_x is not None and parent_y is not None:
        plt.plot([parent_x, x], [parent_y, y], linewidth=1, color='black')

    # Plot left and right subtree with adjusted coordinates
    plot_tree(node.left, x - x_offset, y - y_offset, x, y, x_offset / 2, y_offset)

    plot_tree(node.right, x + x_offset, y - y_offset, x, y, x_offset / 2, y_offset)


root = Node(1)
root.left = Node(2)
root.right = Node(3)
root.left.left = Node(4)
root.left.right = Node(5)
root.right.left = Node(6)
root.right.right = Node(7)

root.right.right.left = Node(2)
root.right.right.right = Node(3)
root.right.right.left.left = Node(4)
root.right.right.left.right = Node(5)
root.right.right.right.left = Node(6)
root.right.right.right.right = Node(7)

plt.figure()
plot_tree(root, 0, 0)
# plt.axis('off')
plt.show()

