Task
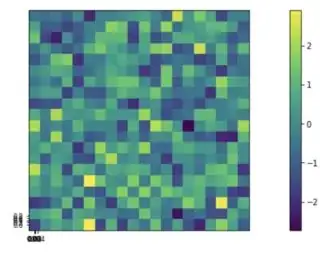
I have a grid of values zs relating to some xs values that are log-spaced, and ys values that are lin-spaced. I tried to make it work as follows but the plot looks weird.
The key problem is that the x-values are in the log-space and the y values are not.
I tried using ax.set_xscale('log') but doesn't seem to do the job. I am not even sure if this is possible, since it's just a grid.
Minimal Working Example
import numpy as np
import matplotlib.pyplot as plt
from numpy.random import default_rng

# x values are log-spaced, y values are lin-spaced
xs = np.geomspace(0.001, 1.0, num=20, endpoint=True)
ys = np.linspace(0.0, 1.0, num=20, endpoint=False)

# Generate z-values randomly for the MWE
zs = np.zeros((20, 20))
rng = default_rng(seed=1234)
for x_ix in range(len(xs)):
    for y_ix in range(len(ys)):
        zs[x_ix, y_ix] = rng.normal()

fig, ax = plt.figure(figsize=(18, 5))
im = ax.imshow(zs, origin='lower')
ax.set_xticks(xs[::4])
ax.set_xticklabels(["{:.2f}".format(x) for x in xs[::4]], fontsize=8)
ax.set_yticks(ys[::4])
ax.set_yticklabels(["{:.1f}".format(y) for y in ys[::4]], fontsize=8)
ax.cax.colorbar(im)
ax.cax.toggle_label(True)
plt.show()
Alternative - pcolor
Following the suggestion, I have coded it as follows.
x_grid, y_grid = np.meshgrid(xs, ys)

fig, ax = plt.subplots(figsize=(18, 5))
im = ax.pcolor(x_grid, y_grid, zs)
ax.set_xscale('log')
fig.colorbar(im)
plt.show()
This works well, only problem is that in practice I have 5 plots in a row and the colorbar is taking the space off the final plot. Basically I am actually using plt.subplots(ncols=5, figsize=(18, 5)) but then when I add the colorbar, the final plot is less wide than the others because it contains the colorbar
