this is my code:
fig, ax = plt.subplots(1,2, figsize = (30, 8))
g1 = sns.lineplot(data = plsWeekly , x = 'Date', y = 'Close', ax=ax[0])
plt.xticks(rotation=70)
g2 = sns.lineplot(data = asxWeekly , x = 'Date', y = 'Close', ax=ax[1])
plt.xticks(rotation=70)
and, this is the output:
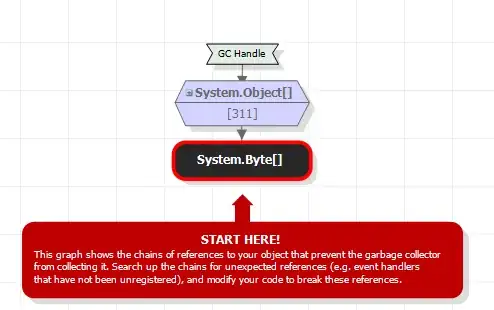
i just tried running the code and I expected that both x labels for the two(2) plots are gonna rotate by 70