14

I have a data surface that I'm fitting using SciPy's leastsq function.

I would like to have some estimate of the quality of the fit after leastsq returns. I'd expected that this would be included as a return from the function, but, if so, it doesn't seem to be clearly documented.

Is there such a return or, barring that, some function I can pass my data and the returned parameter values and fit function to that will give me an estimate of fit quality (R^2 or some such)?

Thanks!

Richard
  • 56,349
  • 34
  • 180
  • 251

1 Answers1

24

If you call leastsq like this:

import scipy.optimize
p,cov,infodict,mesg,ier = optimize.leastsq(
        residuals,a_guess,args=(x,y),full_output=True)

where

def residuals(a,x,y):
    return y-f(x,a)

then, using the definition of R^2 given here,

ss_err=(infodict['fvec']**2).sum()
ss_tot=((y-y.mean())**2).sum()
rsquared=1-(ss_err/ss_tot)

What is infodict['fvec'] you ask? It's the array of residuals:

In [48]: optimize.leastsq?
...
      infodict -- a dictionary of optional outputs with the keys:
                  'fvec' : the function evaluated at the output

For example:

import scipy.optimize as optimize
import numpy as np
import collections
import matplotlib.pyplot as plt

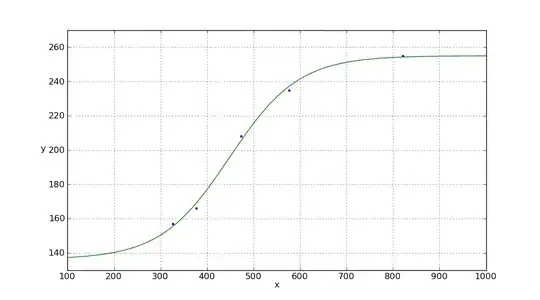
x = np.array([821,576,473,377,326])
y = np.array([255,235,208,166,157])

def sigmoid(p,x):
    x0,y0,c,k=p
    y = c / (1 + np.exp(-k*(x-x0))) + y0
    return y

def residuals(p,x,y):
    return y - sigmoid(p,x)

Param=collections.namedtuple('Param','x0 y0 c k')
p_guess=Param(x0=600,y0=200,c=100,k=0.01)
p,cov,infodict,mesg,ier = optimize.leastsq(
    residuals,p_guess,args=(x,y),full_output=True)
p=Param(*p)
xp = np.linspace(100, 1600, 1500)
print('''\
x0 = {p.x0}
y0 = {p.y0}
c = {p.c}
k = {p.k}
'''.format(p=p))
pxp=sigmoid(p,xp)

# You could compute the residuals this way:
resid=residuals(p,x,y)
print(resid)
# [ 0.76205302 -2.010142    2.60265297 -3.02849144  1.6739274 ]

# But you don't have to compute `resid` -- `infodict['fvec']` already
# contains the info.
print(infodict['fvec'])
# [ 0.76205302 -2.010142    2.60265297 -3.02849144  1.6739274 ]

ss_err=(infodict['fvec']**2).sum()
ss_tot=((y-y.mean())**2).sum()
rsquared=1-(ss_err/ss_tot)
print(rsquared)
# 0.996768131959

plt.plot(x, y, '.', xp, pxp, '-')
plt.xlim(100,1000)
plt.ylim(130,270)
plt.xlabel('x')
plt.ylabel('y',rotation='horizontal')
plt.grid(True)
plt.show()

enter image description here

ajmartin
  • 2,379
  • 2
  • 26
  • 42
unutbu
  • 842,883
  • 184
  • 1,785
  • 1,677
  • Is the above definition of rsquared correct? For each bin, the value of residual^2 should be divided to variance^2 and then at the end, sum up all the results. –  Oct 27 '11 at 10:09
  • @ user1016260 There aren't any errors in the above example, but yes, it should be taken into account in that way. My question is about doing this for different models with different numbers of parameters. Basically with this R^2 method there is no way that the number of parameters are being taken into account. With something like a reduced chi-square, it does. Wouldn't that be best to use for models? This may not be appropriate to discuss here. – astromax Jun 24 '13 at 17:55
  • @astromax You might want to consider something like the . [Akaike Information Criterion (AIC)](http://en.wikipedia.org/wiki/Akaike_information_criterion) – DrSAR Nov 06 '13 at 06:44
  • I would like to know the criteria to choose those parameters and not others. Because I tried this example with different values for the parameters, and the function is always converging and producing the same Rsquared. But if I use too big values for x0/y0, then there is no convergence. My point is, why we need to specify those initial params? How to choose them properly? Do they have to fall in the represented space or "near" the curve? Thanks – Irene Oct 22 '14 at 14:37
  • 1
    @iamgin: `leastsq` uses the [Levenberg–Marquardt algorithm](http://en.wikipedia.org/wiki/Levenberg%E2%80%93Marquardt_algorithm). Per the link, *"In cases with only one minimum, an uninformed standard guess ... will work fine; in cases with multiple minima, the algorithm converges only if the initial guess is already somewhat close to the final solution."* – unutbu Oct 22 '14 at 17:24
  • That is a very fine and revealing answer applicable to other algorithms, thank you very much. But one more thing, what are your "c" and "k", the two parameters needed to define a sigmoid curve? Slope and intercept maybe? – Irene Oct 23 '14 at 09:21
  • 1
    @iamgin: The sigmoid function used above has the form `y = c / (1 + np.exp(-k*(x-x0))) + y0`. When `x` is huge the `exp(...)` is essentially zero so `y` tends toward `c + y0`. When `x` is huge and negative, `exp(...)` is huge, `c / (huge)` tends to 0, so `y` tends toward `y0`. So `y0` is the lower limit -- in the picture around 140, and `c + y0` is the upper limit -- around 250. So `c` is the span or difference 250 - 140 ~ 110. – unutbu Oct 23 '14 at 12:30
  • Where is the p-value supposed to be? E.g., how do we justify the value of R squared obtained as such? – FaCoffee May 12 '16 at 17:32
  • @CF84: The standard [p-value formula](https://www.quora.com/In-ordinary-least-squares-regression-how-do-I-calculate-the-p-value-from-the-standard-error-and-coefficient) only applies to **linear** ordinary least squares. "Caution must be exercised [in the nonlinear case] since the validity of the approximation will depend on the nonlinearity of the model, the variance and distribution of the errors, and the data itself" ([ODRpack95 User Guide PDF, Section 4B](http://netlib.org/toms/869.zip)). – unutbu May 12 '16 at 18:38
  • @CF84: (cont'd) In general I think it is better to apply the [bootstrap method](http://stackoverflow.com/a/21844726/190597). This will give you a confidence interval for the parameters. To translate that into a p-value is a math problem whose solution depends on the above-mentioned cautionary factors. – unutbu May 12 '16 at 18:38