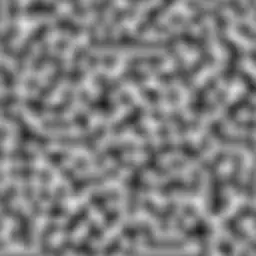
I am reading this picture,
Using the following Python,
import numpy as np
from PIL import Image as im
from matplotlib import pyplot as plt

image = np.array(im.open("optimised.png"))
print(image.shape)
plt.imshow(image)
plt.show()
But this plots a greyscaled image,
Further, the shape is printed as (57, 86) where I expect this to be something like (57, 86, 3).
I opened the image in an image viewer and sure enough, it has color,
What is happening here?


