1

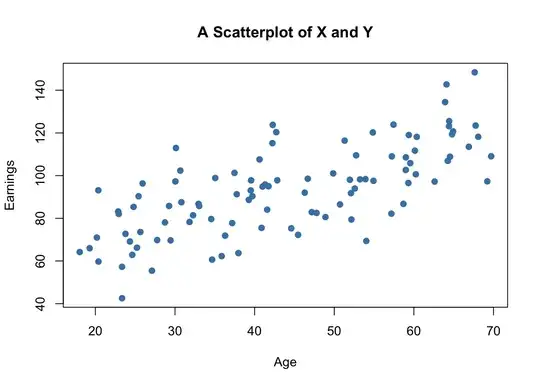
I have a scatterplot, just like the one below:

graph

Let's say I want to create a new column, named QUADRANT, which contains the number that represents a quadrant. For instance, if the point has the y axis between 150 and 120, and the x axis between 0 and 20, it will receive 1. If the y is between 150 and 120, and the x axis between 20 and 40, it will receive 2. And I would do that until the whole quadrant is fullfilled, or at least with y going from 0 to 150, and x going from 0 to 80 and I'm manually defining those limits.

The only thing I could think of was using np.where(), however, I would have to write dozens of lines of code. I was hoping there was a smart way of doing this.

dummyds
  • 177
  • 1
  • 2
  • 8
  • Does this answer your question? [2-dimensional binning with Pandas](https://stackoverflow.com/questions/43422961/2-dimensional-binning-with-pandas) – Arne Apr 18 '23 at 22:54

1 Answers1

1

I don't know the framework you are currently using, as a general response:

First, define your borders like you did:

x_limits = [20, 30, 40, 50, 60, 70]
y_limits = [40, 60, 80, 100, 120, 140]

Then define your QUADRANT and iterate your data. Then add 1 to the quadrant if it belongs to the correct section of the x axis. Then add len(x_limits) plus one to each correct section of the y axis.

quadrants = list()
for y, x in zip(data.earnings, data.ages):
    current_quad = 0
    for x_limit in x_limits:
        current_quad += 1 if x >= x_limit else 0    
    for y_limit in y_limits:
        current_quad += 1 + len(x_limits) if y >= y_limit else 0
    quadrants.append(current_quad)
data.quadrant = quadrants

This algorithm ends up giving the quadrants based on your limits.

I hope it helped.

Alverciito
  • 13
  • 2