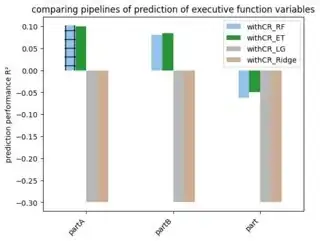
I'm searching for an easy way of adding hatches to my plots in matplotlib. I only want the hatches in specific bars and not for all my bars in the plot. I don't want to manually put settings for each bar.
0) This is a part of my df:
target  withCR_RF   withCR_ET   withCR_LG   withCR_Ridge
0   partA   0.102   0.100   -0.3    -0.3
1   partB   0.081   0.085   -0.3    -0.3
2   part    -0.063  -0.050  -0.3    -0.3

1) This is the code I'm using for the plot:
from matplotlib.colors import ListedColormap

cmap = ListedColormap(['#96C3EB', '#299438', '#B8B8B8', '#CCAC93'])
ax = df.plot.bar(x='target', colormap=cmap)

ax.set_xlabel(None)
ax.set_ylabel('prediction performance R²')
ax.set_title('comparing pipelines of prediction of executive function variables')
plt.xticks(rotation=45, ha='right')
plt.show()
2) Now, I'd like to implement the hatches in the same way as the colors. I don't want all of the bars hatched, but just the first one, so I try this, which doesn't work.
cmap = ListedColormap(['#96C3EB', '#299438', '#B8B8B8', '#CCAC93'])
hatches = ['++', '', '', '']
ax = df.plot.bar(x='target', colormap=cmap, hatch=hatches)

ax.set_xlabel(None)
ax.set_ylabel('prediction performance R²')
ax.set_title('comparing pipelines of prediction of executive function variables')
plt.xticks(rotation=45, ha='right')
plt.show()
I either get all bars hatched or none of them hatched. I don't want hatches for all the bars and I don't want to adapt every bar manually.
3) @Tranbi, thanks for your suggestion. This is now working but not for all light blue bars. There are six light blue bars with the condition withCR_RF (because of 6 targets) but only one bar of them has changed. How can I change all six of them?
cmap = ListedColormap(['#96C3EB', '#299438', '#B8B8B8', '#CCAC93'])
#hatches = ['++', '', '', '']
#hatches = ['', '++', '', '', '', '', 'xx', '', '', '']
ax = df.plot.bar(x='target', colormap=cmap, hatch=hatches)

ax.set_xlabel(None)
ax.set_ylabel('prediction performance R²')
ax.set_title('comparing pipelines of prediction of executive function variables')
plt.xticks(rotation=45, ha='right')


for lbl, patch in zip(ax.get_xticklabels() , ax.patches):
        if lbl.get_text() == 'withCR_RF':
            patch.set_hatch('*')
            patch.set_edgecolor(patch.get_facecolor())
            patch.set_facecolor('none')

plt.show()

4) @Mozway, thanks for your answer. Your last option is perfect for my needs, but is it possible to index more than one bar? This doesn't work, unfortunately. I'd like to have all light blue bars hatched.
cmap = ListedColormap(['#96C3EB', '#299438', '#B8B8B8', '#CCAC93'])
hatches = ['++', '', '', '']
hatches = ['', '++', '', '', '', '', 'xx', '', '', '']
ax = df.plot.bar(x='target', colormap=cmap)
ax.patches[0,1,2,3].set_hatch('+') #see here please
ax.set_xlabel(None)
ax.set_ylabel('prediction performance R²')
ax.set_title('comparing pipelines of prediction of executive function variables')
plt.xticks(rotation=45, ha='right')
plt.show()


