I am trying to create a biplot from iris data set using ggplot2 package. I have used below code to generate the biplot:
library(ggplot2)
library(devtools)


# Load iris dataset
data(iris)


# Run PCA and extract scores and loadings
iris_pca <- prcomp(iris[-5], scale. = TRUE)

scores <- as.data.frame(iris_pca$x)
scores$Species <- iris$Species

loadings <- iris_pca$rotation

# Create biplot
biplot <- ggplot(data = scores, aes(x = PC1, y = PC2)) +
          # Scores on primary scales
          geom_point(aes(color = Species)) +
          # Loadings on secondary scales
          geom_segment(aes(x = 0, y = 0, xend = loadings[1,1], yend = loadings[1,2]),
                       arrow = arrow(length = unit(0.3, "cm"), type = "closed", angle = 25)) +
          geom_segment(aes(x = 0, y = 0, xend = loadings[2,1], yend = loadings[2,2]),
                       arrow = arrow(length = unit(0.3, "cm"), type = "closed", angle = 25)) +
          geom_segment(aes(x = 0, y = 0, xend = loadings[3,1], yend = loadings[3,2]),
                       arrow = arrow(length = unit(0.3, "cm"), type = "closed", angle = 25)) +
          geom_segment(aes(x = 0, y = 0, xend = loadings[4,1], yend = loadings[4,2]),
                       arrow = arrow(length = unit(0.3, "cm"), type = "closed", angle = 25)) +
          # Primary scales
          scale_x_continuous(limits = c(-3, 3), name = "PC1") +
          scale_y_continuous(limits = c(-3, 3), name = "PC2") +
          # Secondary scales
          scale_x_continuous(sec.axis = sec_axis(~ . / 1.2, name = "Loadings on PC1")) +
          scale_y_continuous(sec.axis = sec_axis(~ . / 1.2, name = "Loadings on PC2")) +
          # Theme
          theme_bw()

biplot
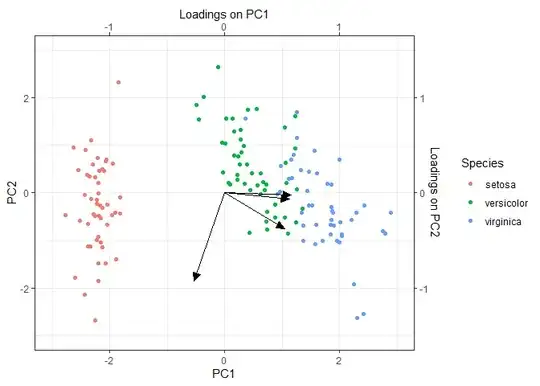
The above code results in a biplot as shown below:

How can I use a different secondary axis scale (limits = c(-0.8, 0.8)) which only affects zooming in the arrows and does not affect the primary scale (also not the scores or points)? Is there any possible way to achieve this? I would be thankful for your cooperation.
Regards, Farhan